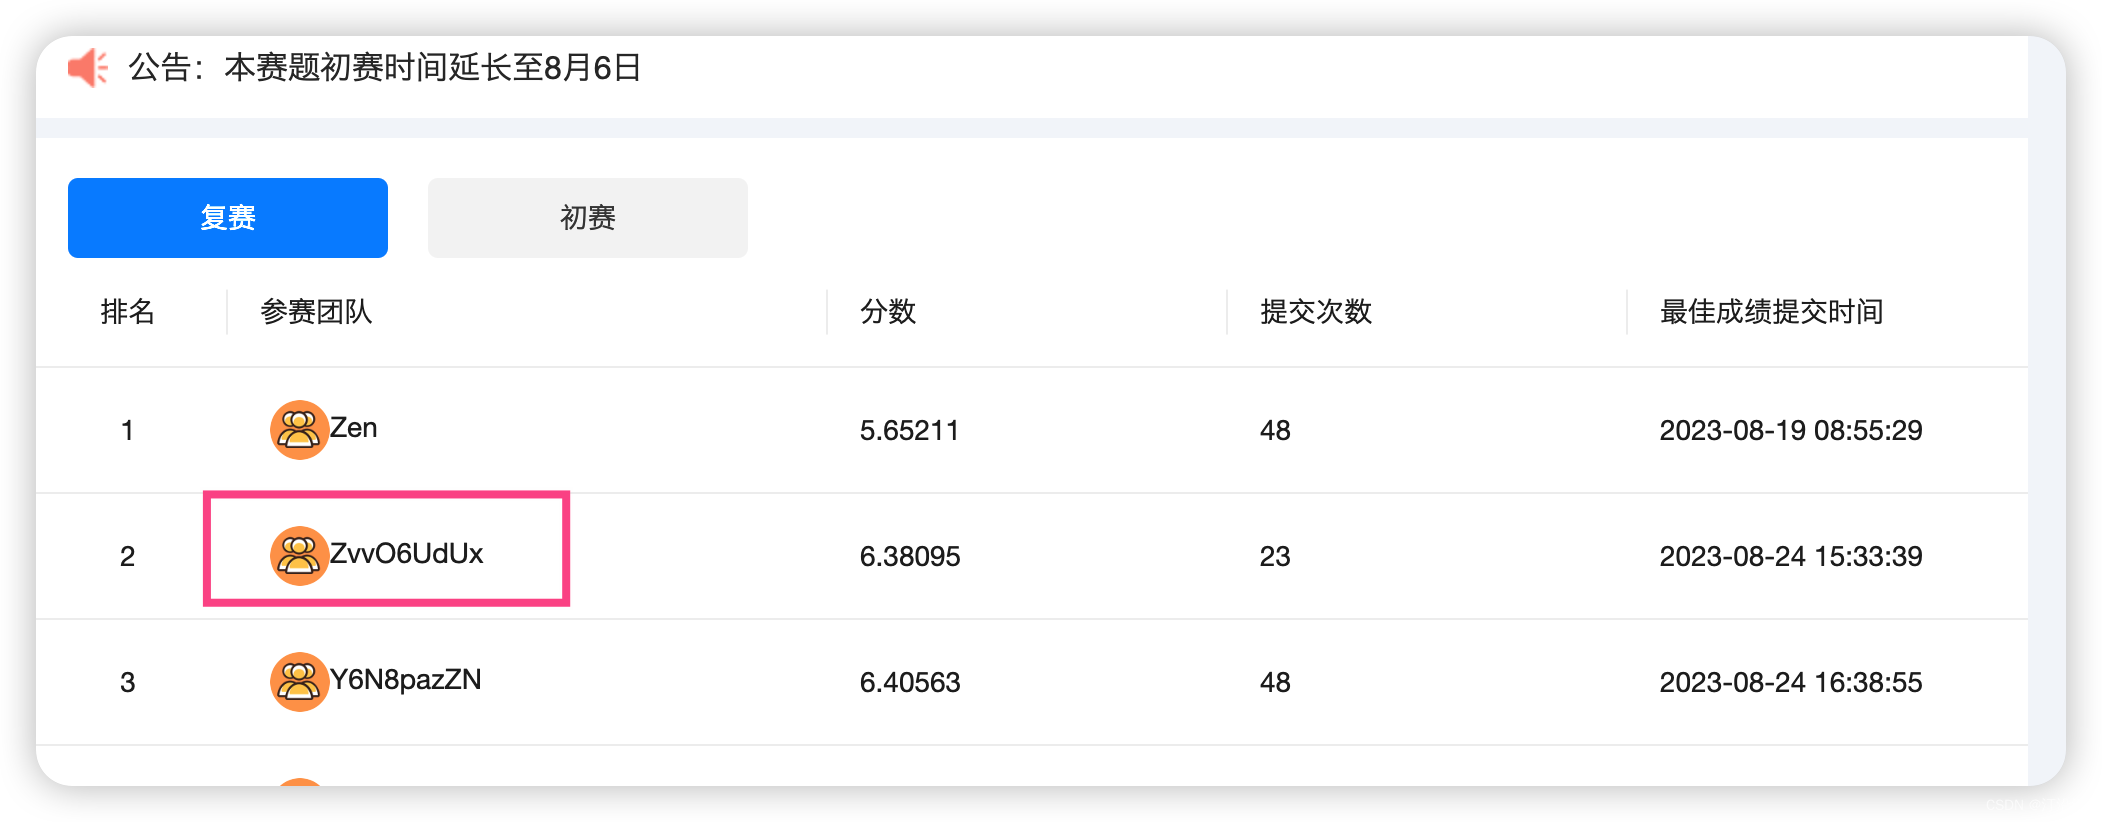
2024 iFLYTEK A.I.开发者大赛-讯飞开放平台
TabNet: 模型也是我在这个比赛一个意外收获,这个模型在比赛之中可用。但是需要GPU资源,否则运行真的是太慢了。后面针对这个模型我会写出如何使用的方法策略。
比赛结束后有与其他两位选手聊天,他们都是对数据做了很多分析,有的甚至直接使用Lasso就work了,效果还挺不错的。特征工程无敌呀。
真个代码部分,了解下有关特征工程的部分就行了,模型部分可以慢慢消化。当作一个新的知识点学习吧。
直接上代码
import matplotlib.pyplot as plt
import numpy as np
import pandas as pd
from tqdm import tqdm
from sklearn.model_selection import KFold
from pytorch_tabnet.metrics import Metric
from pytorch_tabnet.tab_model import TabNetRegressor
import torch
from torch.optim import Adam, SGD
from torch.optim.lr_scheduler import ReduceLROnPlateau, CosineAnnealingWarmRestarts
from sklearn.metrics import mean_absolute_error
import traceback
import warnings
warnings.filterwarnings("ignore")
plt.rcParams['font.sans-serif'] = ['PingFang HK']  # 用来正常显示中文标签
plt.rcParams["axes.Unicode_minus"] = False  # 该语句解决图像中的“-”负号的乱码问题
pd.set_option('precision', 10)
pd.set_option('display.max_rows', None)
# 时间解析模块
def parse_date(train_df=None):
    train_df['datetime'] = pd.to_datetime(train_df['时间'])
    train_df['timestamp'] = train_df['datetime'].astype('int64') / 10000000
    train_df['year'] = train_df['datetime'].dt.year
    train_df['month'] = train_df['datetime'].dt.month
    train_df['day'] = train_df['datetime'].dt.day
    train_df['hour'] = train_df['datetime'].dt.hour
    train_df["minute"] = train_df['datetime'].dt.minute
    train_df['dayofweek'] = train_df['datetime'].dt.dayofweek
    # train_df['datetime'].dt.dayofmonth
    return train_df
def same_position_tempture_resid(train_df, index=[]):
    for i in index:
        train_df[f'下部温度{i}_resid'] = train_df[f'下部温度{i}'] - train_df[f'下部温度设定{i}']
        train_df[f'下部温度{i}_dist_4'] = train_df[f'下部温度设定4'] - train_df[f'下部温度设定{i}']
        train_df[f'下部温度{i}_dist_4_moth_100'] = (train_df[f'下部温度{i}_dist_4'] >= 99) * 1
    return train_df
df_train = pd.read_csv("../data/train.csv")
df_test = pd.read_csv("../data/test.csv")
submit = pd.read_csv("../data/submit.csv")
df_train = parse_date(df_train)
df_test = parse_date(df_test)
df_train = df_train.sort_values("datetime")
df_train = df_train.reset_index(drop=True)
df_train['train'] = 1
df_train.loc[1057, '下部温度9'] = 829
df_test = df_test.sort_values("datetime")
df_test = df_test.reset_index(drop=True)
df_test['train'] = 0
flow_cols = [col for col in df_train.columns if "流量" in col]
up_temp_sets = [col for col in df_train.columns if "上部温度设定" in col]
down_temp_sets = [col for col in df_train.columns if "下部温度设定" in col]
up_tempture = [col for col in df_train.columns if "上部温度" in col and col not in up_temp_sets]
down_tempture = [col for col in df_train.columns if "下部温度" in col and col not in down_temp_sets]
# train_df.columns.tolist()
import re
small_cols = ['下部温度5', '上部温度8', '上部温度9',
              '上部温度10',
              '上部温度11',
              '上部温度12',
              '上部温度13',
              '上部温度14',
              '上部温度15',
              '上部温度16',
              '上部温度17',
              '下部温度3',
              '下部温度4',
              '下部温度6',
              '下部温度7',
              '下部温度8',
              '下部温度9',
              '下部温度10',
              '下部温度11',
              '下部温度12',
              '下部温度13',
              '下部温度14',
              '下部温度15',
              '下部温度16',
              '下部温度17'] + [
                 '上部温度1',
                 '上部温度2',
                 '上部温度3',
                 '上部温度4',
                 '上部温度5',
                 '上部温度6',
                 '上部温度7',
                 '下部温度1',
                 '下部温度2',
             ]
def get_same_temp(test_df, cols):
    for col in cols:
        nums = re.findall("\d+", col)
        num = nums[0]
        if "上部温度" in col:
            print(num, col)
            test_df[col] = test_df[f'上部温度设定{num}']
        elif "下部温度" in col:
            test_df[col] = test_df[f'下部温度设定{num}']
    return test_df
df_test = get_same_temp(df_test, small_cols)
df = pd.concat([df_train, df_test])
df = df.sort_values(['year', 'month', 'day', 'hour', "minute"])
df = df.reset_index(drop=True)
down_label = ['下部温度1', '下部温度2', '下部温度3']
up_label = ['上部温度7', '上部温度1', '上部温度2', '上部温度3', '上部温度4', '上部温度5', '上部温度6']
cat_cols = ['year', 'month', 'day', 'hour', 'minute', 'dayofweek']
keep_cols = df_test.columns.tolist()
def resid_model(y, y_pred):
    # residual plots
    y_pred = pd.Series(y_pred, index=y.index)
    resid = y - y_pred
    mean_resid = resid.mean()
    std_resid = resid.std()
    z = abs(resid) / (y + 0.01)
    # print(z)
    n_outliers = sum(abs(resid) > 10000)
    outliers = y[(abs(resid) > 10000)].index
    print(outliers)
    plt.figure(figsize=(15, 5))
    ax_131 = plt.subplot(1, 3, 1)
    plt.plot(y, y_pred, '.')
    plt.xlabel('y')
    plt.ylabel('y_pred');
    plt.title('corr = {:.3f}'.format(np.corrcoef(y, y_pred)[0][1]))
    ax_132 = plt.subplot(1, 3, 2)
    plt.plot(y, y - y_pred, '.')
    plt.xlabel('y')
    plt.ylabel('y - y_pred');
    plt.title('std resid = {:.3f}'.format(std_resid))
    ax_133 = plt.subplot(1, 3, 3)
    z.plot.hist(bins=50, ax=ax_133)
    plt.xlabel('z')
    plt.title('{:.0f} samples with z>3'.format(n_outliers))
    plt.show()
    # return outliers
def get_down_tempture_sets_resid(df, diffed_col="下部温度设定4",
                                 diff_col='下部温度设定1'):
    distacnce = 0
    if "上部" in diff_col:
        print(f"----- {diff_col}_diff_{diffed_col}")
        df['上部温度设定4_diff_上部温度设定1'] = df['上部温度设定4'] - df['上部温度设定1']
        df[f'{diffed_col}_diff_{diff_col}'] = df[diffed_col] - df[diff_col]
        df['上部温度设定4_div_上部温度设定1'] = df['上部温度设定4'] / df['上部温度设定1']
        df[f'{diffed_col}_div_{diff_col}'] = df[diffed_col] / df[diff_col]
        df['flag'] = (df['上部温度设定4_diff_上部温度设定1'] > 300) * 1
    else:
        df['下部温度设定4_diff_下部温度设定1'] = df['下部温度设定4'] - df['下部温度设定1']
        df['下部温度设定4_div_下部温度设定1'] = df['下部温度设定4'] / df['下部温度设定1']
        df[f'{diffed_col}_diff_{diff_col}'] = df[diffed_col] - df[diff_col]
        df[f'{diffed_col}_div_{diff_col}'] = df[diffed_col] / df[diff_col]
        distacnce = 300
        df['flag'] = (df['下部温度设定4_diff_下部温度设定1'] > 300) * 1
    return df
def get_same_type_tempure(row, df_train, label, woindows):
    try:
        heads = woindows
        train_flag = int(row['train'])
        hour = row['hour']
        minute = row['minute']
        timesamp = row['timestamp']
        flag = row['flag']
        nums = re.findall("\d+", label)
        num = int(nums[0])
        chars = re.findall("(\w+)(\d+)", label)[0][0]
        label_map_set_col = f"{chars}设定{num}"
        set_temps = row[label_map_set_col]
        # (df_train[label_map_set_col]==set_temps)&
        df_temp_ = df_train[
            (df_train[label_map_set_col] == set_temps) & (df_train['flag'] == flag) & (df_train['hour'] == hour) & (
                        df_train['timestamp']


