
Echarts-知识图谱
demo地址
打开CodePen
效果
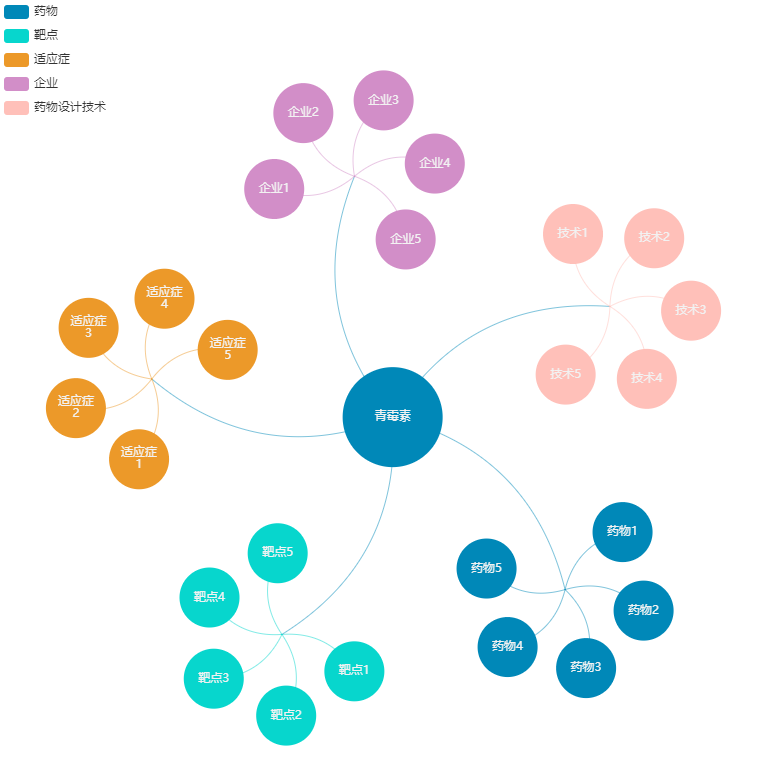
思路
1. 生成根节点
2. 根据子节点距离与根节点的角度关系,生成子节点坐标,进而生成子节点
3. 从子节点上按角度生成对应的子节点
4. 递归将根节点与每一层级子节点连线
核心代码
- 定义节点配置
function getNodeConfig() { return { /** 节点间距 */ nodeLine: 120, /** 节点大小 */ nodeSize: 100, /** 子节点间距 */ subNodeLine: 40, /** 子节点大小 */ subNodeSize: 60 }; }- 创建节点位置
function createNodePos({ index: i, len: iLen }) { const { nodeLine } = getNodeConfig(); const radioDeg = (Math.PI * 2) / iLen; const deg = i * radioDeg + Math.PI / 4; const x = nodeLine * Math.cos(deg); const y = nodeLine * Math.sin(deg); const pos = { x, y }; return pos; }- 创建子节点位置
function createSubNodePos({ index: i, len: iLen }, { index: j, len: jLen }) { const { nodeLine, subNodeLine } = getNodeConfig(); const radioDeg = (Math.PI * 2) / iLen; const deg = i * radioDeg + Math.PI / 4; const parentX = nodeLine * Math.cos(deg); const parentY = nodeLine * Math.sin(deg); const subRadioDeg = (Math.PI * 2) / (jLen + 1); const subDeg = j * subRadioDeg + (Math.PI / 2) * 3 + deg; const x = parentX + subNodeLine * Math.cos(subDeg); const y = parentY + subNodeLine * Math.sin(subDeg); const pos = { x, y }; return pos; }- 创建节点和链接
function initOption(root) { root.categoryItem = categories?.[root?.category] || {}; const list = chartList || []; const graph = { ...createNodesLinks(list, root), categories }; const chartOption = { color: categories?.map((item) => item?.color), legend: [ { orient: 'vertical', left: 0, data: graph.categories.map(function (a) { return a.name; }) } ], tooltip: { formatter: (params) => { return params?.data?.name; } }, animationDuration: 1500, animationEasingUpdate: 'quinticInOut', series: [ { type: 'graph', layout: 'none', force: { repulsion: 100 }, data: graph.nodes, links: graph.links, categories: graph.categories, roam: true, label: { show: true, width: 36, height: 36, overflow: 'breakAll', color: '#f2f2f2', formatter: (params) => { const { name = '', id } = params?.data || {}; const len = id === rootId ? 20 : 10; return name?.length > len ? name?.slice(0, len) + '...' : name; } }, lineStyle: { color: 'source', curveness: 0.3 }, emphasis: { focus: 'adjacency', disabled: true, lineStyle: { width: 10 } } } ] }; option = chartOption; } function createNodesLinks(list = [], root = {}) { const nodes = []; const links = []; const { nodeSize, subNodeSize } = getNodeConfig(); nodes.push({ id: rootId, category: 0, name: '根节点', ...root, symbolSize: nodeSize, x: 0, y: 0 }); for (let i = 0; i- 初始化
function init() {
  const { id, name, key } = { id: '1', name: '青霉素', key: 'drug-research' }
  const category = categories?.findIndex((item) => item?.key === key);
  const categoryItem = categories?.[category];
  initOption({
    category,
    dataId: id,
    name,
    id: rootId
  })
}
完整代码
var dom = document.getElementById('chart-container');
var myChart = echarts.init(dom, null, {
  renderer: 'canvas',
  useDirtyRect: false
});
var app = {};
var option;
const categories = [
    {
      name: '药物',
      color: 'rgba(0, 136, 184, 1)',
      key: 'drug-research',
      enumKey: 'Drug',
      fieldKey: 'drug',
      idKey: 'drug_uid',
      nameKey: 'drug_name_cn',
      nameEnKey: 'drug_name_en'
    },
    {
      name: '靶点',
      color: 'rgba(7, 214, 205, 1)',
      key: 'target-spot',
      enumKey: 'Target',
      fieldKey: 'target',
      idKey: 'target_uid',
      nameKey: 'target_name'
    },
    {
      name: '适应症',
      color: 'rgba(236, 153, 41, 1)',
      key: 'indications',
      enumKey: 'Indication',
      fieldKey: 'indication',
      idKey: 'indication_uid',
      nameKey: 'indication_name'
    },
    {
      name: '企业',
      color: 'rgba(210, 142, 200, 1)',
      key: 'company',
      enumKey: 'Entity',
      fieldKey: 'entity',
      idKey: 'entity_uid',
      nameKey: 'entity_name'
    },
    {
      name: '药物设计技术',
      color: 'rgba(255, 192, 185, 1)',
      key: 'drug-tech',
      enumKey: 'Tech',
      fieldKey: 'tech',
      idKey: 'tech_name',
      nameKey: 'tech_name'
    }
  ];
const rootId = 'root';

const serverMapData = {
  "drug": [
    {
      "drug_uid": "1",
      "drug_name_cn": "药物1",
      "drug_name_en": "药物en"
    },
    {
      "drug_uid": "2",
      "drug_name_cn": "药物2",
      "drug_name_en": "药物en"
    },
    {
      "drug_uid": "3",
      "drug_name_cn": "药物3",
      "drug_name_en": "药物en"
    },
    {
      "drug_uid": "4",
      "drug_name_cn": "药物4",
      "drug_name_en": "药物en"
    },
    {
      "drug_uid": "5",
      "drug_name_cn": "药物5",
      "drug_name_en": "药物en"
    },
  ],
  "target": [
    {
      "target_uid": "1",
      "target_name": "靶点1",
      "target_code": [
        "string"
      ]
    },
    {
      "target_uid": "2",
      "target_name": "靶点2",
      "target_code": [
        "string"
      ]
    },
    {
      "target_uid": "3",
      "target_name": "靶点3",
      "target_code": [
        "string"
      ]
    },
    {
      "target_uid": "4",
      "target_name": "靶点4",
      "target_code": [
        "string"
      ]
    },
    {
      "target_uid": "5",
      "target_name": "靶点5",
      "target_code": [
        "string"
      ]
    },
  ],
  "indication": [
    {
      "indication_uid": "1",
      "indication_name": "适应症1",
      "indication_code": [
        "string"
      ]
    },
    {
      "indication_uid": "2",
      "indication_name": "适应症2",
      "indication_code": [
        "string"
      ]
    },
    {
      "indication_uid": "3",
      "indication_name": "适应症3",
      "indication_code": [
        "string"
      ]
    },
    {
      "indication_uid": "4",
      "indication_name": "适应症4",
      "indication_code": [
        "string"
      ]
    },
    {
      "indication_uid": "5",
      "indication_name": "适应症5",
      "indication_code": [
        "string"
      ]
    },
  ],
  "entity": [
    {
      "entity_uid": "1",
      "entity_name": "企业1",
      "entity_code": [
        "string"
      ]
    },
    {
      "entity_uid": "2",
      "entity_name": "企业2",
      "entity_code": [
        "string"
      ]
    },
    {
      "entity_uid": "3",
      "entity_name": "企业3",
      "entity_code": [
        "string"
      ]
    },
    {
      "entity_uid": "4",
      "entity_name": "企业4",
      "entity_code": [
        "string"
      ]
    },
    {
      "entity_uid": "5",
      "entity_name": "企业5",
      "entity_code": [
        "string"
      ]
    },
  ],
  "tech": [
    {
      "tech_name": "技术1"
    },
    {
      "tech_name": "技术2"
    },
    {
      "tech_name": "技术3"
    },
    {
      "tech_name": "技术4"
    },
    {
      "tech_name": "技术5"
    },
  ]
}

const chartList = categories?.map((categoryItem) => {
  const dataList = serverMapData?.[categoryItem?.fieldKey] || [];
  return dataList?.map((item) => {
    return {
      ...item,
      categoryItem,
      dataId: item?.[categoryItem?.idKey],
      name: item?.[categoryItem?.nameKey] || item?.[categoryItem?.nameEnKey]
    };
  });
});
init();
function init() {
  const { id, name, key } = { id: '1', name: '青霉素', key: 'drug-research' }
  const category = categories?.findIndex((item) => item?.key === key);
  const categoryItem = categories?.[category];
  initOption({
    category,
    dataId: id,
    name,
    id: rootId
  })
}

function initOption(root) {
    root.categoryItem = categories?.[root?.category] || {};
    const list = chartList || [];
    const graph = {
      ...createNodesLinks(list, root),
      categories
    };
    const chartOption = {
      color: categories?.map((item) => item?.color),
      legend: [
        {
          orient: 'vertical',
          left: 0,
          data: graph.categories.map(function (a) {
            return a.name;
          })
        }
      ],
      tooltip: {
        formatter: (params) => {
          return params?.data?.name;
        }
      },
      animationDuration: 1500,
      animationEasingUpdate: 'quinticInOut',
      series: [
        {
          type: 'graph',
          layout: 'none',
          force: {
            repulsion: 100
          },
          data: graph.nodes,
          links: graph.links,
          categories: graph.categories,
          roam: true,
          label: {
            show: true,
            width: 36,
            height: 36,
            overflow: 'breakAll',
            color: '#f2f2f2',
            formatter: (params) => {
              const { name = '', id } = params?.data || {};
              const len = id === rootId ? 20 : 10;
              return name?.length > len ? name?.slice(0, len) + '...' : name;
            }
          },
          lineStyle: {
            color: 'source',
            curveness: 0.3
          },
          emphasis: {
            focus: 'adjacency',
            disabled: true,
            lineStyle: {
              width: 10
            }
          }
        }
      ]
    };
    console.log('chartOption', chartOption)
    option = chartOption;
  }
  function createNodesLinks(list = [], root = {}) {
    const nodes = [];
    const links = [];
    const { nodeSize, subNodeSize } = getNodeConfig();
    nodes.push({
      id: rootId,
      category: 0,
      name: '根节点',
      ...root,
      symbolSize: nodeSize,
      x: 0,
      y: 0
    });
    for (let i = 0; i
- 初始化
- 创建节点和链接
- 创建子节点位置
- 创建节点位置