
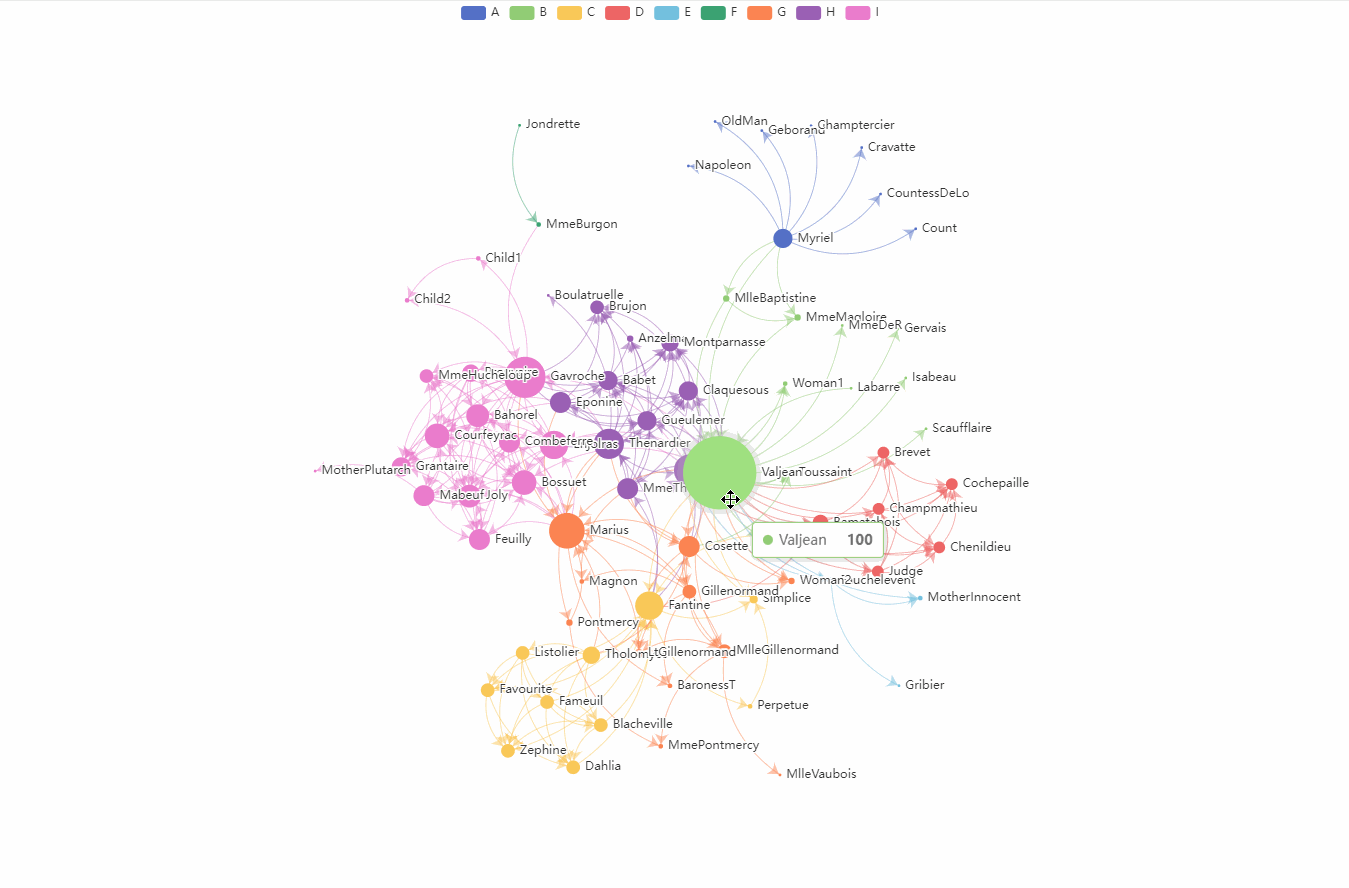
效果
环境
- echarts: ^5.5.0
- lodash: ^4.17.21
- next: 14.1.3
- react: ^18
目录
仅包含涉及到的文件
| - app
   |- page.tsx
| - components
    |- echarts
       |- graph
          |- echarts.ts
          |- index.tsx
实操
创建EchartsGraph组件
- components/echarts/graph/index.tsx
"use client" import react, {useEffect, useRef} from "react"; import EchartsContainer from "./echarts" type Props = { nodes: object[], edges: object[], categories: object[] } const ChartBoxStyles:react.CSSProperties = { width: '100%', height: '100%' } const EchartsGraph = function (props: Props) { let echartsRef = useRef(null); useEffect(()=>{ const chart = EchartsContainer(echartsRef.current); chart.setOption({ legend: [ { data: props.categories.map(function (a:any) { return a.name; }) } ], series: [ { nodes: props.nodes, edges: props.edges, categories: props.categories, } ] }); // 绑定鼠标松开触发事件,用于固定节点 chart.on('mouseup', function (params: any) { let option = chart.getOption(); option.series[0].nodes[params.dataIndex].x = params.event.offsetX || option.series[0].nodes[params.dataIndex].x; option.series[0].nodes[params.dataIndex].y = params.event.offsetY || option.series[0].nodes[params.dataIndex].y; option.series[0].nodes[params.dataIndex].fixed = true; chart.setOption(option); }) }, []) return ( echartsRef} style={ChartBoxStyles}/ ) } export default EchartsGraph- components/echarts/graph/echarts.ts
import type { EChartsType } from "echarts"
import _ from "lodash"
import * as echarts from "echarts"
class EchartsContainer {
    protected _echarts: EChartsType|null = null;
    protected _option:any = {}
    constructor(dom?:HTMLElement) {
        if (!window || !dom)throw Error('Not Set HTMLElement')
        this._echarts = echarts.init(dom);
        this._echarts?.showLoading();
        this._initOption();
    }
    private _initOption(){
        this._option.tooltip = {};
        this._option.legend = [];
        this._option.series = [
            {
                type: 'graph',
                // 布局: none、circular、force
                layout: 'force',
                // 开启动画
                animation: true,
                // 初始动画的时长
                animationDuration: 1500,
                // 数据更新动画的缓动效果
                animationEasingUpdate: 'quinticInOut',
                // 边两端的标记类型
                // @link https://echarts.Apache.org/zh/option.html#series-graph.edgeSymbol
                edgeSymbol: ['arrow', ''],
                // @link https://echarts.apache.org/zh/option.html#series-graph.force
                force: {
                    // 边的两个节点之间的距离,这个距离也会受 repulsion。
                    // 值最大的边长度会趋向于 10,值最小的边长度会趋向于 50
                    edgeLength: 120,
                    // 节点之间的斥力因子
                    repulsion: 500,
                    // 节点受到的向中心的引力因子(该值越大节点越往中心点靠拢)。
                    gravity: .2,
                    // 减缓节点的移动速度(取值范围 0 到 1)
                    friction: .6
                },
                // 是否开启鼠标缩放和平移漫游
                roam: true,
                // 节点是否可拖拽
                draggable: true,
                // 高亮状态的图形样式
                // @link https://echarts.apache.org/zh/option.html#series-graph.emphasis
                // DEPRECATED: itemStyle.emphasis has been changed to emphasis.itemStyle since 4.0
                emphasis:{
                    //鼠标放上去有阴影效果
                    itemStyle: {
                        shadowColor: '#cccccc',
                        shadowOffsetX: 0,
                        shadowOffsetY: 0,
                        shadowBlur: 40,
                    },
                },
                // 文本标签配置
                // @link https://echarts.apache.org/zh/option.html#series-graph.label
                label: {
                    show: true,
                    position: 'right',
                    formatter: '{b}'
                },
                // 标签的统一布局配置
                // @link https://echarts.apache.org/zh/option.html#series-graph.labelLayout
                // labelLayout: {
                //     hideOverlap: true,
                // },
                // 针对节点之间存在多边的情况,自动计算各边曲率,默认不开启。
                // @link https://echarts.apache.org/zh/option.html#series-graph.autoCurveness
                // autoCurveness: true,
                // 滚轮缩放的极限控制
                // @link https://echarts.apache.org/zh/option.html#series-graph.scaleLimit
                scaleLimit: {
                    min: 0.4,
                    max: 2
                },
                // 关系边的公用线条样式
                // @link https://echarts.apache.org/zh/option.html#series-graph.lineStyle
                lineStyle: {
                    color: 'source',
                    // 边的曲度,支持从 0 到 1 的值,值越大曲度越大。
                    curveness: .3
                },
                categories: [],
            }
        ];
        this.setOption(this._option);
        this._echarts?.hideLoading();
    }
    public setOption(option: any){
        if (Object.keys(option).length>0){
            this._echarts?.setOption(_.merge({}, this._option, option))
        }
    }
    public getOption(){
        return this._echarts?.getOption();
    }
    public on(event: string, handler: any){
        this._echarts?.on(event, handler)
    }
}
const getSingle = (className: any) => {
    if (typeof className !== 'function') {
        throw('参数必须为一个类或一个函数')
    }
    const single = (fn: Function) => {
        let instance:any = null
        return (...args:any[]) => {
            if (!instance) {
                instance = fn.call(null, ...args)
            }
            return instance;
        }
    }
    const fn = (...args: any[]) => {
        return new className(...args);
    };
    return single(fn);
}
export default getSingle(EchartsContainer)
页面调用
demo数据源于官方的一个演示接口数据:
https://echarts.apache.org/examples/data/asset/data/les-miserables.json
import EchartsGraph from "@/components/echarts/graph";
import demoData from "./demo"
export default function Home() {
  return (
    {
        width: '100%',
        height: '100vh'
    }}
      demoData.nodes}
                    edges={demoData.links}
                    categories={demoData.categories} /

  );
}
- components/echarts/graph/echarts.ts
- components/echarts/graph/index.tsx