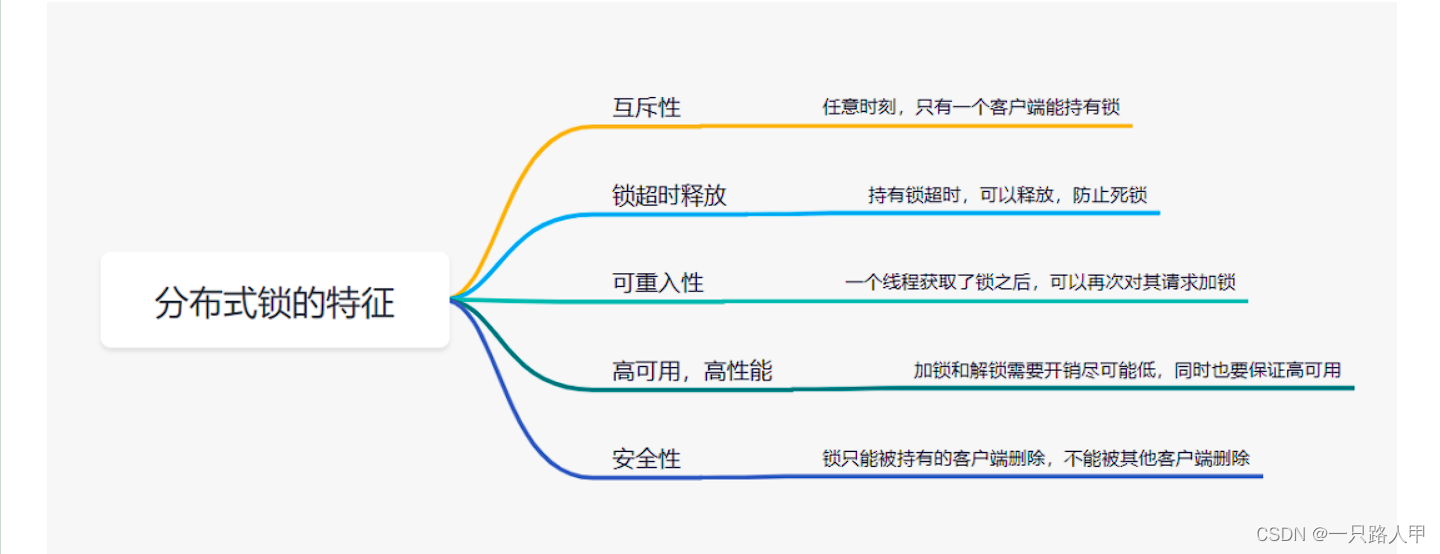

一、测试注意点
1、缓存预热
如果程序初次运行,此时由于数据尚未加载到缓存,则程序的响应时间会明显变长
注意事项: 性能测试的时候 出现 非常不稳定的现象程序刚启动,它的性能 明显 低于 已经运行一段时间的
1.1 测试缓存没有的情况, 系统性能是怎么样的? 以及 多久才能恢复到正常的性能
找开发 - 把数据清空,模拟干净的环境
1.2 测试 缓存已经加载的情况, 系统运行了一段时间,各种业务场景都执行过几轮之后
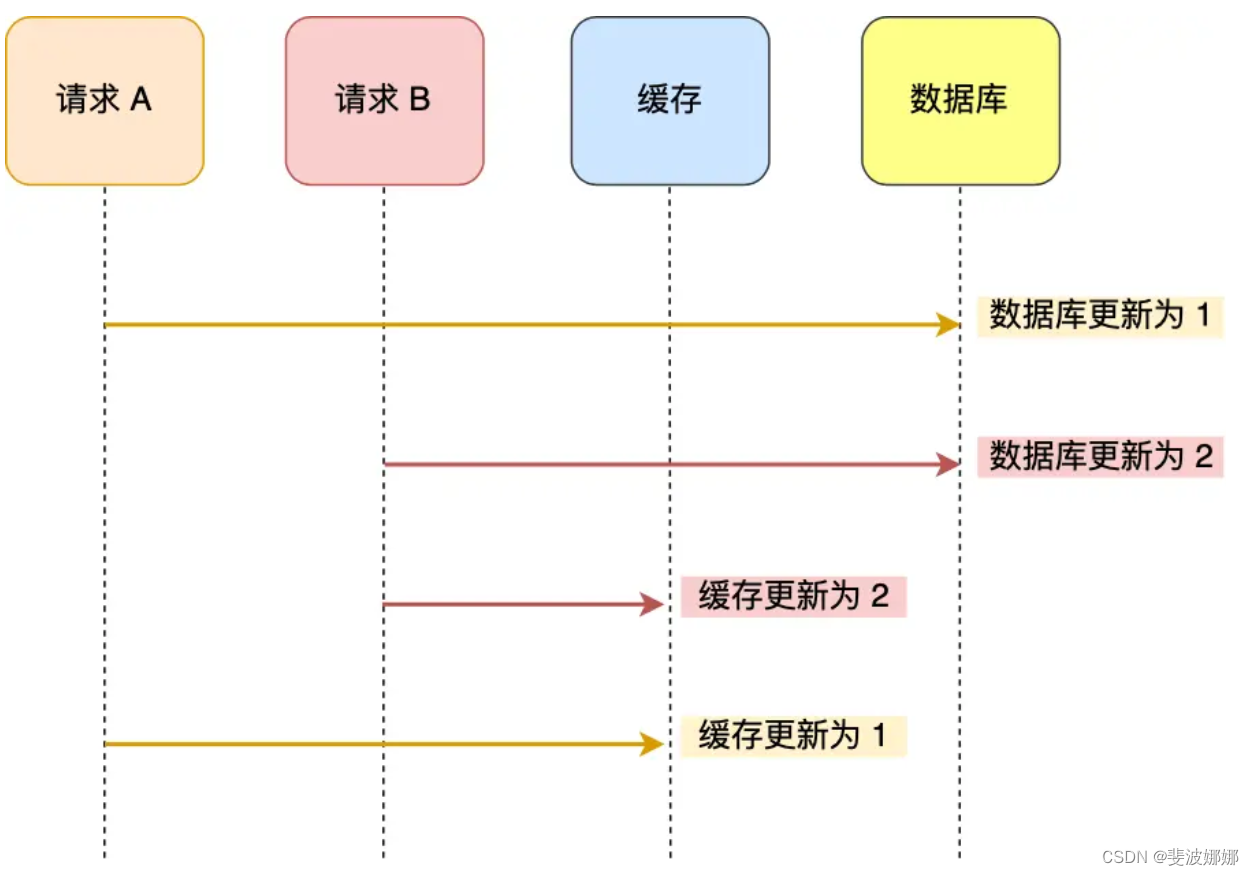
2、缓存雪崩
模拟redis 挂掉,服务核心主流程是否能运行(允许慢,不能挂掉),重启redis,多长时间可以恢复缓存服务——容错性测试
概念:
测试方法:
解决方法:
3、缓存击穿
概念:如果查询的目标是不存在于系统中的数据,则缓存必然失效,缓存大量Miss,可能会导致高并发请求大量 怼到数据库,数据库 处理不过来,可能会影响系统性能,甚至导致系统崩溃
测试方法:请求数据库中不存在的数据,验证系统性能,如果吞吐量下降,说明响应了系统性能
解决方法:数据库中不存在的数据,缓存中保留一条值为null的数据,使得异常请求命中缓存。
二、Redis 瓶颈分析
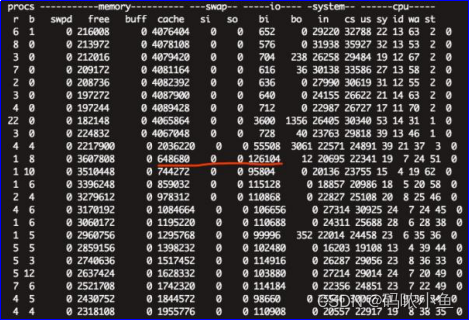
1.1、redis 资源占用
连接redis后,输入info
Server:服务器
Clients:客户端
Memory:内存
Persistence:持久化配置信息
State:server的一些基本统计信息
keyspace_hits:226 命中次数
keyspace_misses:74 miss次数
Replication 获取 server 的主从配置信息
CPU 获取 server 的 CPU 使用信息
usedcpusys 2.559564 消耗的系统CPU
usedcpuuser 0.878593 消耗的用户CPU
usedcpusys_children 0.001414 后台进程占用的系统CPU
usedcpuuser_children 0.000510 后台进程占用的用户CPU
Keyspace:获取 server 中各个 DB 的 key 的数量
cluster:获取集群节点信息,仅在开启集群后可见
这个集群 类似 数据库 分库分表
你要监控的服务器 不止一台
[root@VM-100-3-centos ~]# redis-cli
127.0.0.1:6379> info
# Server
redis_version:6.2.6
redis_git_sha1:00000000
redis_git_dirty:0
redis_build_id:d767c00d74be2727
redis_mode:standalone
os:Linux 4.14.105-cc1e1d6+ x86_64
arch_bits:64
multiplexing_api:epoll
atomicvar_api:atomic-builtin
gcc_version:4.8.5
process_id:2135
process_supervised:no
run_id:4d98d5f7c709c98b5173dd3c0de6e1eb4d335c4a
tcp_port:6379
server_time_usec:1710399051990387
uptime_in_seconds:21878714
uptime_in_days:253
hz:10
configured_hz:10
lru_clock:15900235
executable:/usr/local/redis/bin/./redis-server
config_file:
io_threads_active:0
# Clients
connected_clients:2
cluster_connections:0
maxclients:10000
client_recent_max_input_buffer:24
client_recent_max_output_buffer:0
blocked_clients:0
tracking_clients:0
clients_in_timeout_table:0
# Memory
used_memory:894728
used_memory_human:873.76K
used_memory_rss:6557696
used_memory_rss_human:6.25M
used_memory_peak:952816
used_memory_peak_human:930.48K
used_memory_peak_perc:93.90%
used_memory_overhead:850944
used_memory_startup:809840
used_memory_dataset:43784
used_memory_dataset_perc:51.58%
allocator_allocated:939016
allocator_active:1191936
allocator_resident:3706880
total_system_memory:8100679680
total_system_memory_human:7.54G
used_memory_lua:37888
used_memory_lua_human:37.00K
used_memory_scripts:0
used_memory_scripts_human:0B
number_of_cached_scripts:0
maxmemory:0
maxmemory_human:0B
maxmemory_policy:noeviction
allocator_frag_ratio:1.27
allocator_frag_bytes:252920
allocator_rss_ratio:3.11
allocator_rss_bytes:2514944
rss_overhead_ratio:1.77
rss_overhead_bytes:2850816
mem_fragmentation_ratio:7.70
mem_fragmentation_bytes:5705736
mem_not_counted_for_evict:0
mem_replication_backlog:0
mem_clients_slaves:0
mem_clients_normal:41000
mem_aof_buffer:0
mem_allocator:jemalloc-5.1.0
active_defrag_running:0
lazyfree_pending_objects:0
lazyfreed_objects:0
# Persistence
loading:0
current_cow_size:0
current_cow_size_age:0
current_fork_perc:0.00
current_save_keys_processed:0
current_save_keys_total:0
rdb_changes_since_last_save:0
rdb_bgsave_in_progress:0
rdb_last_save_time:1706699504
rdb_last_bgsave_status:ok
rdb_last_bgsave_time_sec:0
rdb_current_bgsave_time_sec:-1
rdb_last_cow_size:471040
aof_enabled:0
aof_rewrite_in_progress:0
aof_rewrite_scheduled:0
aof_last_rewrite_time_sec:-1
aof_current_rewrite_time_sec:-1
aof_last_bgrewrite_status:ok
aof_last_write_status:ok
aof_last_cow_size:0
module_fork_in_progress:0
module_fork_last_cow_size:0
# Stats
total_connections_received:28
total_commands_processed:321
instantaneous_ops_per_sec:0
total_net_input_bytes:39598
total_net_output_bytes:256555
instantaneous_input_kbps:0.00
instantaneous_output_kbps:0.00
rejected_connections:0
sync_full:0
sync_partial_ok:0
sync_partial_err:0
expired_keys:15
expired_stale_perc:0.00
expired_time_cap_reached_count:0
expire_cycle_cpu_milliseconds:225406
evicted_keys:0
keyspace_hits:226
keyspace_misses:74
pubsub_channels:0
pubsub_patterns:0
latest_fork_usec:158
total_forks:15
migrate_cached_sockets:0
slave_expires_tracked_keys:0
active_defrag_hits:0
active_defrag_misses:0
active_defrag_key_hits:0
active_defrag_key_misses:0
tracking_total_keys:0
tracking_total_items:0
tracking_total_prefixes:0
unexpected_error_replies:0
total_error_replies:1
dump_payload_sanitizations:0
total_reads_processed:349
total_writes_processed:322
io_threaded_reads_processed:0
io_threaded_writes_processed:0
# Replication
role:master
connected_slaves:0
master_failover_state:no-failover
master_replid:8e3d6429b68f282d137fc409d69a3b8b6d74ef8d
master_replid2:0000000000000000000000000000000000000000
master_repl_offset:0
second_repl_offset:-1
repl_backlog_active:0
repl_backlog_size:1048576
repl_backlog_first_byte_offset:0
repl_backlog_histlen:0
# CPU
used_cpu_sys:5421.144797
used_cpu_user:6813.855050
used_cpu_sys_children:0.019651
used_cpu_user_children:0.003743
used_cpu_sys_main_thread:5421.141904
used_cpu_user_main_thread:6813.850376
# Modules
# Errorstats
errorstat_ERR:count=1
# Cluster
cluster_enabled:0
# Keyspace
db0:keys=1,expires=0,avg_ttl=0
127.0.0.1:6379>
2、有大量连接
通过info 查看有多少连接
3、响应时间
如何发现影响慢:
(1)info commandstats:查看哪些命令执行的慢
127.0.0.1:6379> info commandstats
# Commandstats
cmdstat_info:calls=1,usec=115,usec_per_call=115.00,rejected_calls=0,failed_calls=0
cmdstat_command:calls=1,usec=397,usec_per_call=397.00,rejected_calls=0,failed_calls=0
cmdstat_keys:calls=0,usec=0,usec_per_call=0.00,rejected_calls=1,failed_calls=0
cmdstat_get:calls=286,usec=1068,usec_per_call=3.73,rejected_calls=0,failed_calls=0
cmdstat_setex:calls=19,usec=140,usec_per_call=7.37,rejected_calls=0,failed_calls=0
cmdstat_exists:calls=15,usec=27,usec_per_call=1.80,rejected_calls=0,failed_calls=0
cmdstat_hello:calls=1,usec=4,usec_per_call=4.00,rejected_calls=0,failed_calls=0
127.0.0.1:6379>
(2)redis 慢查询日志
slowlog get
127.0.0.1:6379> slowlog get
(empty array)
127.0.0.1:6379>
响应慢的原因:(1)持久化(2)有大量过期(Redis自动删除,也要消耗资源)
三、调优分析
Redis本身的性能很好,大部分的问题在于 开发人员没有用好Redis
1、pipelining 管道批处理
比如 将大量数据 加载到 redis就可以用 管道
2、Redis处理命令时采取的单线程,所以不需要大量 Redis连接
3、Redis的应用场景对速度要求很高,采用合理的数据类型,更快速的操作
纯开发场景
例如 用户信息保存场景
采用字符串 string 类型
set u1001 "{userid:1001,uname:tony,...}"
每一次查询 必须从redis 查询所有的内容
增加 网络消耗,增加处理的资源占用
采用 hash
类似 python 嵌套的 字典
可以 将 用户信息 分为多个key进行存放
通过 Redis 使用课程, 做一个额外的补充
4、尽量避免让开发使用复杂的命令
例如 keys
Redis 里面
标记为 O(1) 命令,代表速度快
O(n)、 O(logn) 速度较慢
如果你看到慢查询日志 里边大量的命令,都是 非 O(1),就需要让开发人员看下是否能使用其他复杂低的命令代替
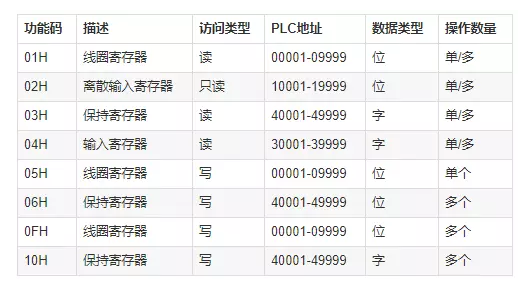
Redis 集群介绍及测试思路 - 知乎