
模式识别与图像处理课程实验一:图像处理实验-->> 颜色算子实验、Susan、Harris角点检测实验、 sobel边缘算子检测实验
- 一、 实验内容
- 二、 颜色算子实验
- 2.1、 提取红色
- 2.2、 提取绿色
- 2.3、 提取蓝色
- 三、 Susan、Harris角点检测实验
- 3. 1、 实验程序
- 3.1.1、Susan角点检测
- 3.1.2、Harris角点检测
- 四、 sobel边缘算子检测实验
- 4.1、sobel边缘算子检
- 五、 实验总结

一、 实验内容
要求编写一个包含颜色算子,Susan,Harris,角点,sobel边缘算子的程。
二、 颜色算子实验
2.1、 提取红色
- 实验的程序如下
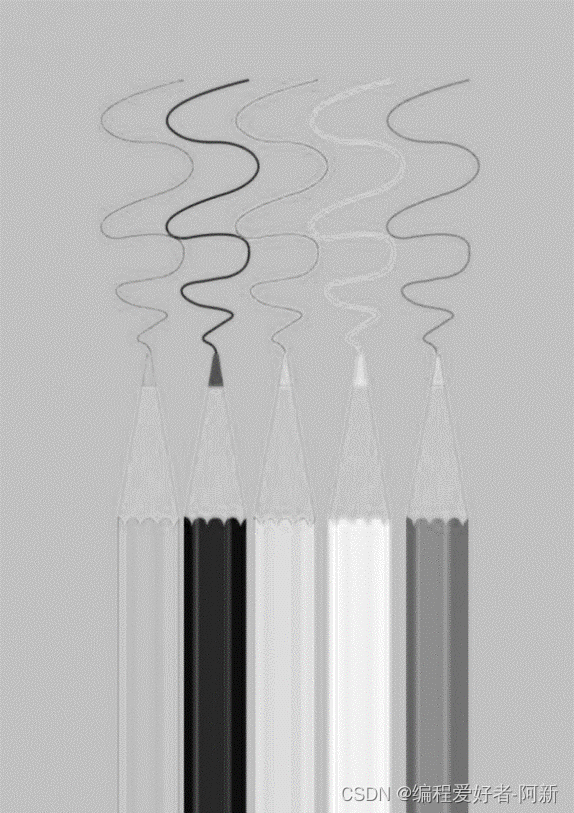
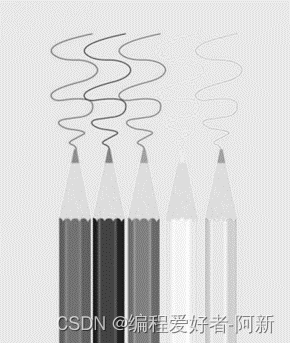
import numpy as np import cv2 as cv image = cv.imread("1.jpg") image = image / np.ones([1, 1, 3]).astype(np.float32) image = cv.cvtColor(image, cv.COLOR_BGR2RGB) print(image.shape) # 颜色算子 # red redAdd = np.ones([1, 1, 3]).astype(np.float32) redAdd[0, 0, 0] = 1.0 redAdd[0, 0, 1] = 0.5 redAdd[0, 0, 2] = 0.25 redSub = np.ones([1, 1, 3]).astype(np.float32) redSub[0, 0, 0] = 0.25 redSub[0, 0, 1] = 0.5 redSub[0, 0, 2] = 1.0 image1 = np.mean(image * redAdd, 2) image2 = np.mean(image * redSub, 2) + 100 imageRed = image1 / image2 redMax = np.max(imageRed) redMin = np.min(imageRed) imageRed = 255 * (imageRed - redMin) / (redMax - redMin) cv.imwrite("1red.png", imageRed)- 实验原图

- 实验结果图
2.2、 提取绿色
实验的程序如下
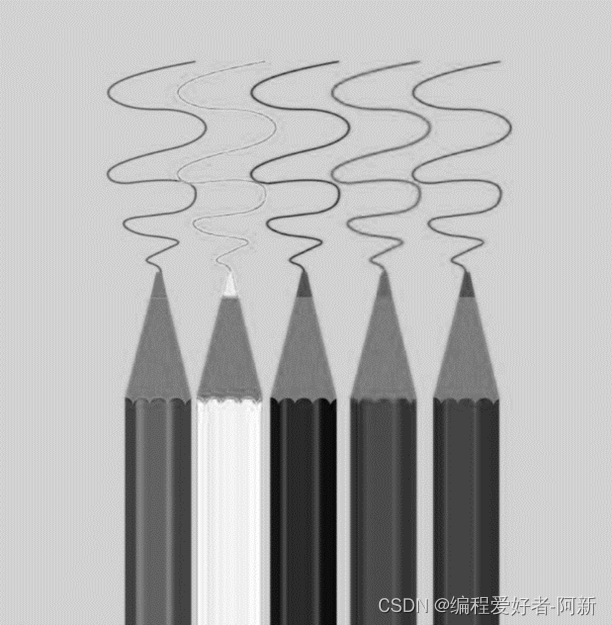
import numpy as np
import cv2 as cv
image = cv.imread("1.jpg")
image = image / np.ones([1, 1, 3]).astype(np.float32)
image = cv.cvtColor(image, cv.COLOR_BGR2RGB)
print(image.shape)
# green
greenAdd = np.ones([1, 1, 3]).astype(np.float32)
greenAdd[0, 0, 0] = 0.5
greenAdd[0, 0, 1] = 1.0
greenAdd[0, 0, 2] = 0.25
greenSub = np.ones([1, 1, 3]).astype(np.float32)
greenSub[0, 0, 0] = 0.5
greenSub[0, 0, 1] = 0.25
greenSub[0, 0, 2] = 1.0
image1 = np.mean(image * greenAdd, 2)
image2 = np.mean(image * greenSub, 2) + 100
imageGreen = image1 / image2
greenMax = np.max(imageGreen)
greenMin = np.min(imageGreen)
imageRed = 255 * (imageGreen - greenMin) / (greenMax - greenMin)
cv.imwrite("1green.png", imageRed)
运行结果如下
-
实验原图

-
实验结果图
2.3、 提取蓝色
- 实验的程序如下
import numpy as np
import cv2 as cv
image = cv.imread("1.jpg")
image = image / np.ones([1, 1, 3]).astype(np.float32)
image = cv.cvtColor(image, cv.COLOR_BGR2RGB)
print(image.shape)
# bule
buleAdd = np.ones([1, 1, 3]).astype(np.float32)
buleAdd[0, 0, 0] = 0.25
buleAdd[0, 0, 1] = 0.5
buleAdd[0, 0, 2] = 1.0
buleSub = np.ones([1, 1, 3]).astype(np.float32)
buleSub[0, 0, 0] = 1.0
buleSub[0, 0, 1] = 0.5
buleSub[0, 0, 2] = 0.25
image1 = np.mean(image * buleAdd, 2)
image2 = np.mean(image * buleSub, 2) + 100
imageBlue = image1 / image2
blueMax = np.max(imageBlue)
blueMin = np.min(imageBlue)
imageBlue = 255 * (imageBlue - blueMin) / (blueMax - blueMin)
cv.imwrite("1blue.png", imageBlue)
运行结果如下
-
实验原图

-
实验结果图
三、 Susan、Harris角点检测实验
3. 1、 实验程序
3.1.1、Susan角点检测
Susan角点检测程序如下
import numpy as np import cv2 as cv image = cv.imread("2.jpg") image = np.mean(image, 2) height = image.shape[0] width = image.shape[1] print(image.shape) #susan 算子 radius = 5 imageSusan = np.zeros([height, width]).astype(np.float32) for h in range(radius, height-radius): for w in range(radius, width-radius): numSmall = 0 numLarge = 0 numAll = 0 for y in range(-radius, radius + 1): for x in range(-radius, radius+1): distance = np.sqrt(y**2 + x**2) if distance image[h, w] + 27: numLarge += 1 ratio = 1.0 * numSmall / numAll ratio2 = 1.0 * numLarge / numAll if ratio 0.7: imageSusan[h, w] = ratio2 - 0.7 imageMax = np.max(imageSusan) imageMin = np.min(imageSusan) imageSusan = 255*(imageSusan - imageMin)/(imageMax - imageMin) print(imageSusan.shape) cv.imwrite("2.png", imageSusan)- 运行结果如下
-
实验原图
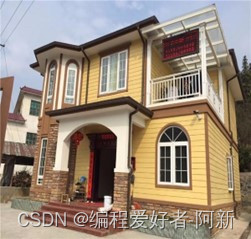
-
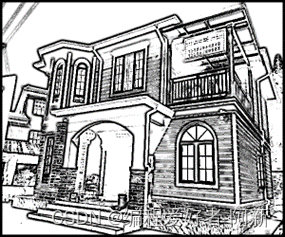
实验结果图
3.1.2、Harris角点检测
- Harris角点检测程序如下
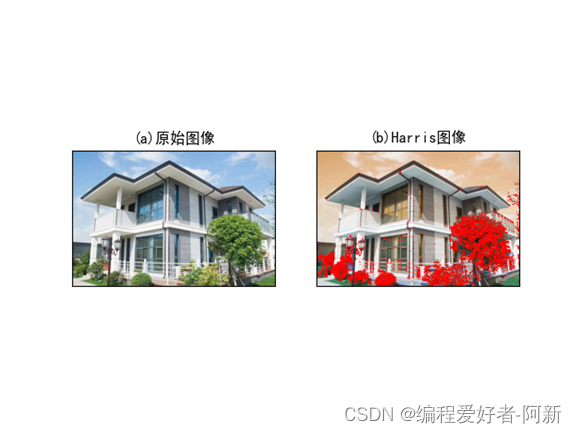
import cv2 as cv
import numpy as np
import matplotlib.pyplot as plt
# 读取图像
img = cv.imread('3.jpg')
lenna_img = cv.cvtColor(img, cv.COLOR_BGR2RGB)
# 图像转换成灰度图像
grayImage = cv.cvtColor(img, cv.COLOR_BGR2GRAY)
grayImage = np.float32(grayImage)
# Harris算子
harrisImage = cv.cornerHarris(grayImage, 2, 3, 0.04)
harrisImage = cv.dilate(harrisImage, None)
# 设置阈值
thresImage = 0.006 * harrisImage.max()
img[harrisImage > thresImage] = [255, 0, 0]
# 显示正常中文的标签
plt.rcParams['font.sans-serif'] = ['SimHei']
titles = [u'(a)原始图像', u'(b)Harris图像']
images = [lenna_img, img]
for i in range(2):
    plt.subplot(1, 2, i + 1), plt.imshow(images[i], 'gray')
    plt.title(titles[i])
    plt.xticks([]), plt.yticks([])
plt.show()
运行结果如下
四、 sobel边缘算子检测实验
4.1、sobel边缘算子检
- sobel边缘算子检程序如下
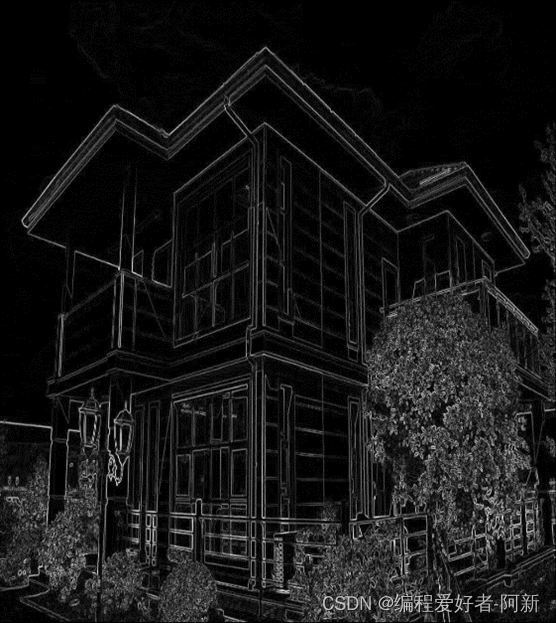
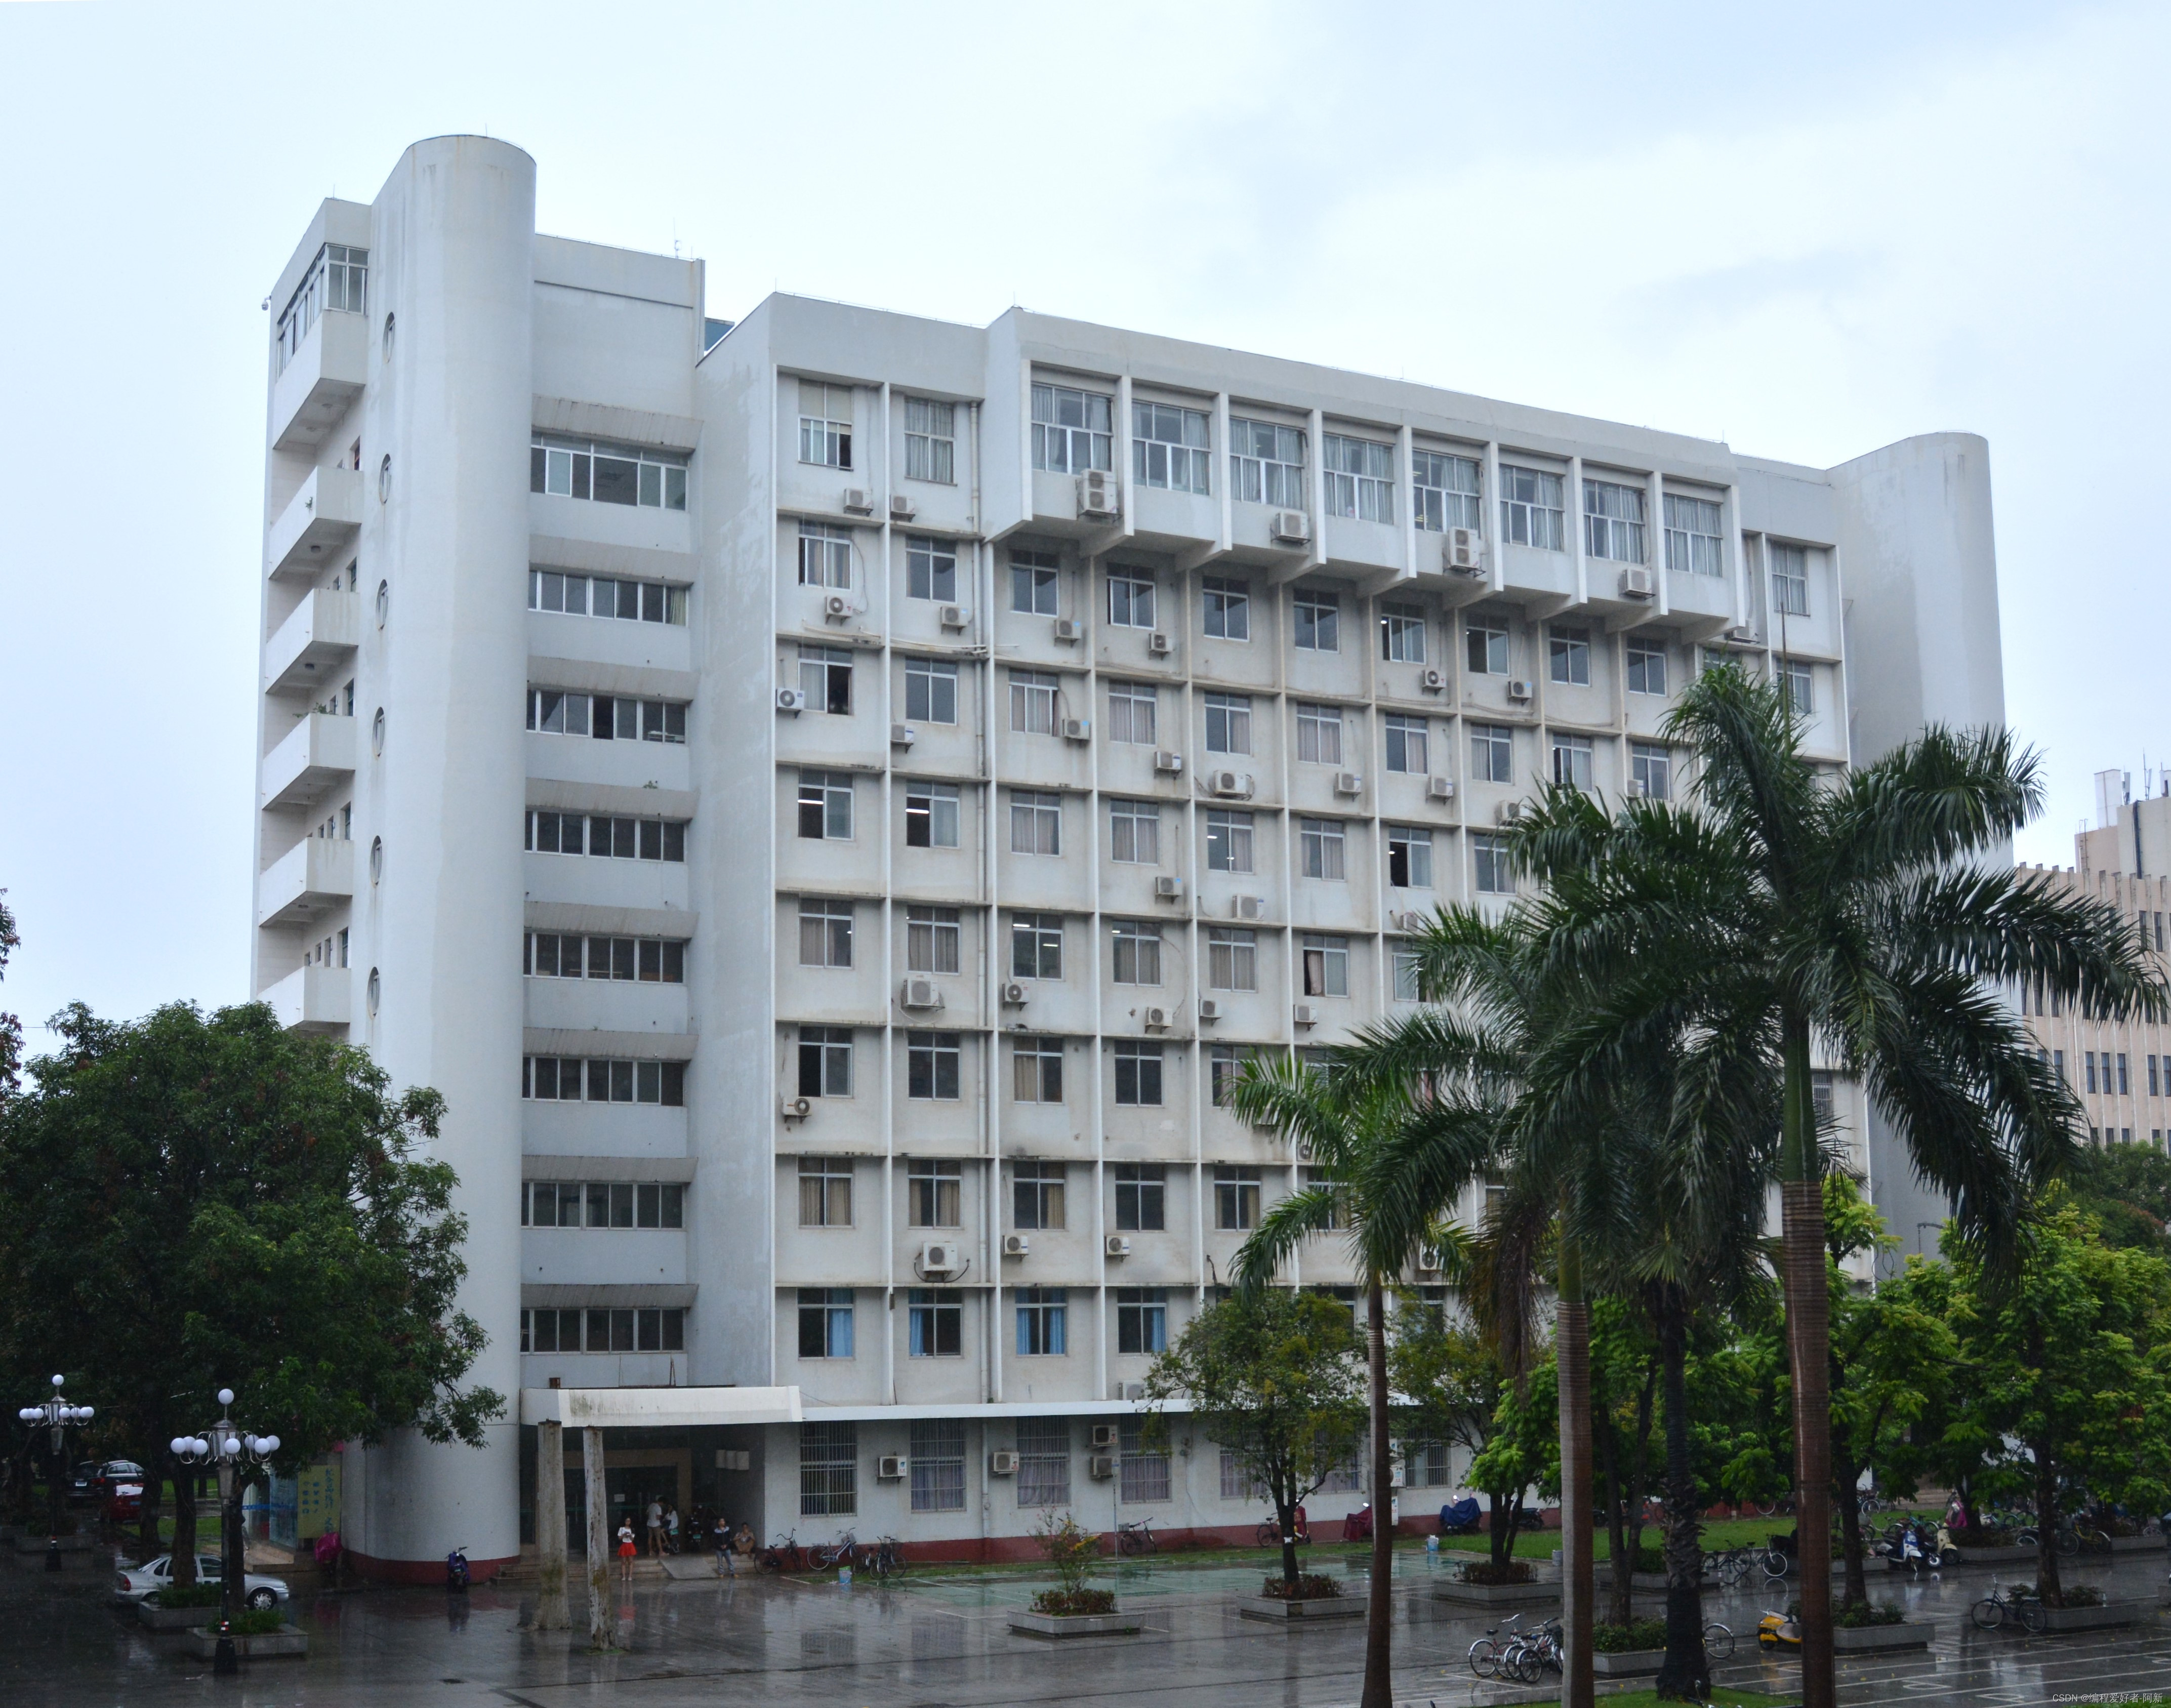
import numpy as np
import cv2
image = cv2.imread("3.jpg")
height = image.shape[0]
width = image.shape[1]
sobelResult = np.zeros([height - 2, width - 2, 1]).astype(np.float32)
sobelX = np.zeros([3, 3, 1]).astype(np.float32)
sobelY = np.zeros([3, 3, 1]).astype(np.float32)
sobelX[0, 0, 0] = -1
sobelX[1, 0, 0] = -2
sobelX[2, 0, 0] = -1
sobelX[0, 2, 0] = 1
sobelX[1, 2, 0] = 2
sobelX[2, 2, 0] = 1
sobelY[0, 0, 0] = -1
sobelY[0, 1, 0] = -2
sobelY[0, 2, 0] = -1
sobelY[2, 0, 0] = 1
sobelY[2, 1, 0] = 2
sobelY[2, 2, 0] = 1
for h in range(0, height - 3):
    for w in range(0, width - 3):
        #求方向梯度
        imageIncre = image[h:h + 3, w:w + 3]
        gradientX = np.sum(imageIncre * sobelX)
        gradientY = np.sum(imageIncre * sobelY)
        gradient = np.sqrt(gradientX**2 + gradientY**2)
        sobelResult[h, w, 0] = gradient
imageMax = np.max(sobelResult)
imageMin = np.min(sobelResult)
sobelResult = 255*(sobelResult - imageMin) / (imageMax - imageMin)
cv2.imwrite("3.png", sobelResult)
2、 运行结果如下
-
实验原图
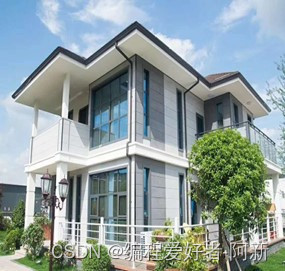
-
实验结果图
五、 实验总结
- 1、 掌握了编写含颜色算子图像处理、Susan与Harris角点图像检测、sobel边缘算子图像检测的程序编写方法。
- 2、 通过实验、对于边缘检测算子与角点检测算子有了进一步的掌握。
-
- sobel边缘算子检程序如下
-
-
- 实验原图
- 实验的程序如下