
一、前言
重要的事情放在最前面:max30102只适用于指尖手指测量,不适用与手腕手指测量,如需做成可穿戴样式选择传感器的小伙伴请pass掉他,因为他只有红光和红外2种光,不够充足的数据源去运算。
由于一些原因,本篇文章所有下载资源不收取任何积分,让你不花一分钱教你如何使用stm32驱动和使用max30102这个传感器,对大学生做毕设的很友好,如果帮助到你了,请在评论区说明有帮助,给与我能量继续为你们开源哦。
二、环境
stm32f1xx(我是用的是c8t6)
keil5
qt5.7
三、正文
简单的概括,从你有需求,到确认物料使用,到采购物料,到使用物料做成品,到调试使用中间会涉及很多环节,在文章开头就把最重要的说出来了,如果你想做穿戴在手腕上或贴在皮肤表面的,不适用这个传感器,他的原理是透过血管,采集图像,在经过算法分析,如果光无法透过血管,采集的数据特征不明显,那么准确率就没有了,实用性也就没有了,如果只是用在手指检测,那么可以继续往下看了。
在网上搜索有很多很多的模块再买,资料也是有很多,在b站和各种论坛使用这种传感器成功的也有很多,都是打着开源的口号,然后背地里收钱,网上还有很多付费花积分下载的资源,下载下来也是不能直接用的,是不好使的。
1.电路设计
首先附上我是用单片机的最小系统电路,这就很简单了,新手小白也能一下子就看懂
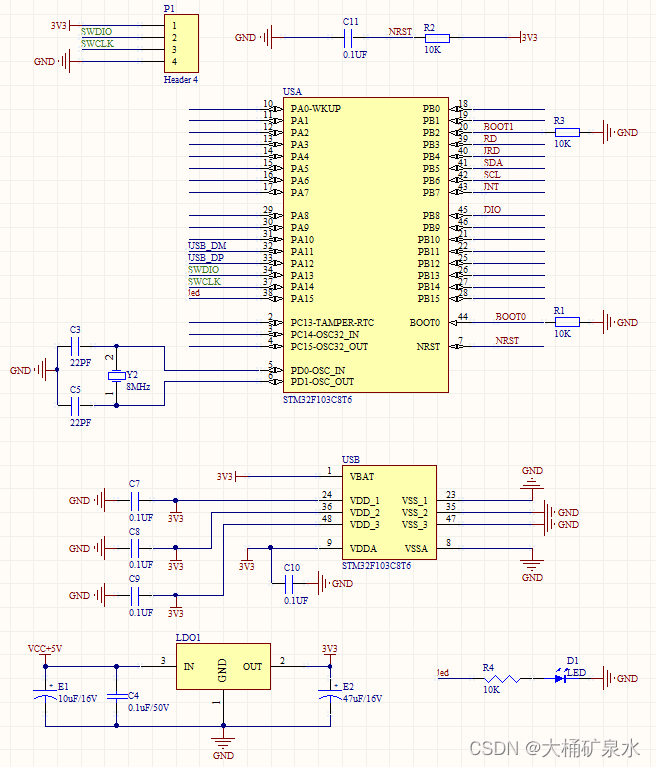
这里我把图片缩小,单击就能方大看了,就是stm32最小系统
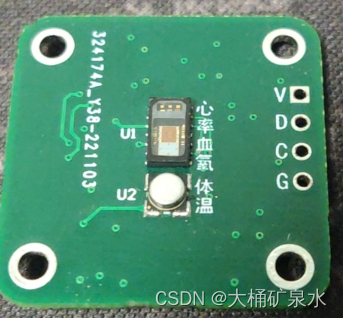
然后是传感器电路图,我看网上很多模块都是使用到1.8V,在看了官方手册实际3.3V也可以为设备供电和使用了,原理图如下
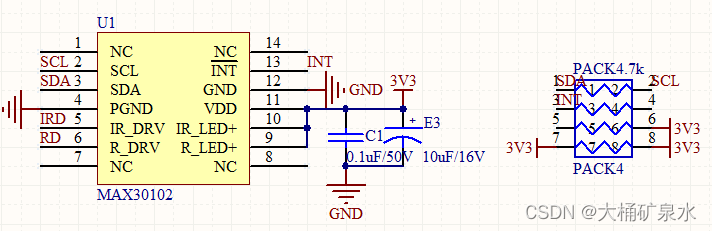
这里我把IIC信号和中断信号用0402的排阻上拉,大家伙可以用封装稍微大一些的电阻
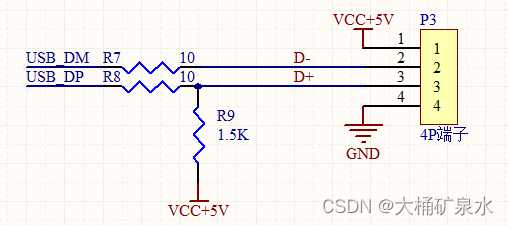
再有就是USB端子部分了,因为整体使用的是USB通信,通过USB连接电脑,软件端使用虚拟串口,与上位机通讯使用的是串口通讯方式,相当于省去了CH340芯片。
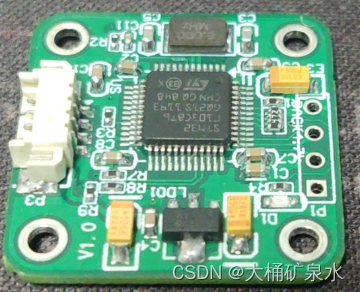
最后在某创白嫖一下四层板,在焊接元器件,洗板水刷个板,硬件就干干净净的出炉了
2.程序编写
硬件完毕,就是软件的活了,软件我也是一开始在网上找现成的程序,毕竟能省去很多的研究时间,经过一两天晚上的寻找,发现网上很多程序都是骗积分的,根本不能用,再有就是带了一大堆乱七八糟的外设驱动,程序结构也是乱七八糟,这个也不是抱怨什么,都可以理解,因为编程习惯是看入门是使用的谁家教程,就习惯谁家的程序结构,比如我特别使用某原子的库函数程序结构,有些人用的是某火的结构,有些人是某xx的结构,各有各的习惯,这里不多说,继续。
软件主要增加3个文件,分别是myiic.c max30102.c algorithm.c这三个程序分别是硬件iic引脚驱动程序,max30102时序逻辑驱动程序和对应采集数据算法程序,这三个文件基本把和自己设计的硬件引荐对应好,基本就没什么问题了,最主要的是main.c中程序,这里我在网上下载了10几个程序,没有一个在main函数里驱动部分写注释的,都是一模一样的,再有就是写的乱七八糟,没有任何说明的,我把main.c驱动部分写了中文注释,让你会清晰的静下心来了解程序是如何实现逻辑的(一开始我也是很懵圈,下载的里程连main调用部分都特别复杂,都不知道从哪里入手,也没有中文注释),以上三个程序在下面开源资源中。
这里把main.c的程序发出来,因为有很多小伙伴看了这里,根本就不需要下载我的资源,就可以在自己的程序上一下子调通了。
#include "sys.h"
#include "delay.h"
#include "string.h"
#include "usart.h"
#include "led.h"
#include "usb_lib.h"
#include "hw_config.h"
#include "usb_pwr.h"
#include "timer.h"
#include "stdlib.h"
#include "ct1711.h"
#include "max30102.h"
#include "algorithm.h"
#include "myiic.h"
//串口数据包
char senddate[16]={0x5A,0xA5,0,0,0,0,0,0,0,0,0,0,0x53,0x54,0x4F,0x50};//缓存容量5A A5 温度2字节(1000倍,高前低后) 心率曲线2字节(高前低后) 心率2字节(高前低后) 心率检测状态  血氧2字节(高前低后) 血氧检测状态 53 54 4F 50
//max30102参数
uint32_t aun_ir_buffer[500]; //IR LED sensor data   红外数据,用于计算血氧
int32_t n_ir_buffer_length=500;    //data length
uint32_t aun_red_buffer[500];    //Red LED sensor data  红光数据,用于计算心率曲线以及计算心率
int32_t n_sp02; //SPO2 value
int8_t ch_spo2_valid;   //indicator to show if the SP02 calculation is valid
int32_t n_heart_rate;   //heart rate value
int8_t  ch_hr_valid;    //indicator to show if the heart rate calculation is valid
#define MAX_BRIGHTNESS 255
int main(void)
{
	//USB通信变量
	u32 len;
	u8 usbstatus=0;
	//max30102变量
	uint32_t un_min, un_max, un_prev_data;
	int i,j;
	int32_t n_brightness;
	float f_temp;
	u8 temp[6];
	//初始化系统
	delay_init();	    	 //延时函数初始化
	NVIC_PriorityGroupConfig(NVIC_PriorityGroup_2);	 //设置NVIC中断分组2:2位抢占优先级,2位响应优先级
	JTAG_Set(JTAG_SWD_DISABLE);     //=====关闭JTAG接口
    JTAG_Set(SWD_ENABLE);           //=====打开SWD接口 可以利用主板的SWD接口调试
	uart1_init(115200);
	LED_Init();		  		//初始化与LED连接的硬件接口
	TIM3_Int_Init(49,7199);//10Khz的计数频率,计数到50为5ms


	//max30102初始化
	max30102_init();
	//下面这些在主程序循环执行,在保证硬件没问题的情况下,无需在初始化中执行一次,反正也没有做什么保护和提示措施
//	un_min=0x3FFFF;
//	un_max=0;
//  n_ir_buffer_length=500; //缓冲区长度100存储5秒的运行在100sps的样本
//	//读取前500个样本,确定信号范围
//  for(i=0;isetWindowModality(Qt::ApplicationModal);
    //读取数据库历史串口配置
    COMS="COM13";
    open_serialport(0,COMS);//初始化串口
    ///初始化定时器
    QTimer *timebaty=new QTimer;
    timebaty->start(1000);//1s更新频率
    connect(timebaty,SIGNAL(timeout()),this,SLOT(timeisout()));//定时器1
    ///菜单栏绑定槽
    connect(ui->action_L,SIGNAL(triggered()),this,SLOT(start_clicked()));//开始采集
    connect(ui->action_R,SIGNAL(triggered()),this,SLOT(fw_data()));//复位数据
    connect(ui->action_set,SIGNAL(triggered()),this,SLOT(setcan()));
    connect(ui->action_back,SIGNAL(triggered()),this,SLOT(theback()));//退出程序
    connect(ui->pushButton,QPushButton::clicked,[=](){setcan();});
    ///初始化曲线
//    AIxx.clear();//清除x数据
    y_history[0].clear();//清除y数据
    y_history[1].clear();//清除y数据
    y_history[2].clear();//清除y数据
    y_history[3].clear();//清除y数据
    QCustomPlot_Init(ui->customplot1,1);
    QCustomPlot_Init(ui->customplot2,2);
    QCustomPlot_Init(ui->customplot3,3);
    ///复位数据
    fw_data();
}
MainWindow::~MainWindow()
{
    delete ui;
}
void MainWindow::timeisout()
{
    //刷新系统时间和系统运行时间
    ui->label_runtime->setText(QDateTime::currentDateTime().toString(QString::fromUtf8("yyyy年MM月dd日 HH:mm:ss")));
    //计算通讯速率
    static uint32_t number=0;
    if(m_allnumlabel_speed->setText(QString::number(number/1024)+"KByte/s  RX:"+QString::number(m_allnum));
    number=m_allnum;
}
///串口配置start/
//初始化/复位串口
void MainWindow::open_serialport(bool reset,QString comstr)
{
    if(reset){
        serial->clear();//先关闭之前的串口
        serial->close();
    }
    serial = new QSerialPort(comstr);
    serial->open(QIODevice::ReadWrite);//读写打开
    serial->setBaudRate(921600);  //波特率QSerialPort::Baud9600
    serial->setDataBits(QSerialPort::Data8); //数据位
    serial->setParity(QSerialPort::NoParity);    //无奇偶校验
    serial->setStopBits(QSerialPort::OneStop);   //无停止位
    serial->setFlowControl(QSerialPort::NoFlowControl);  //无控制
    connect(serial,SIGNAL(readyRead()),this,SLOT(serialRead()));//连接串口读取函数
}
//串口回调函数
void MainWindow::serialRead()
{
    static QByteArray allData;
    while (!serial->atEnd()){
        allData += serial->readAll().toHex();
        comBatAnalyze(allData);//处理串口得到的数据
    }
}
//处理串口得到的数据5AA5 0000 0000 00 0000 00 53544F50
void MainWindow::comBatAnalyze(QByteArray &allData)
{
    QByteArray dataTemp;
    bool ok;
    int len=0;
    int start;
    int move;
    dataTemp=allData.toUpper();
    while((len=dataTemp.count())>=16*2){//最少长度为13+数据0
      move=2;
      start=dataTemp.indexOf("5AA5",0);//搜索字符,返回搜索到的起始位置
      if(start>=0){
         len=len-start;//将5AA5做为开头,长度随之变化
         dataTemp=dataTemp.right(len);//从右侧裁剪len长度数据保存
         if(len>=16*2){
             if(dataTemp.mid(0,4)=="5AA5"&&dataTemp.mid(24,8)=="53544F50"){
//                 QByteArray aaa=QByteArray::fromHex(dataTemp);
//                 uint16_t temp=((aaa[2]graph(0)->setName(QString(""));
    if(mode==1)CustomPlot->graph(1)->setName(QString(""));
    //设置横坐标显示倍数
    QSharedPointer pITicker(new QCPAxisTickerPi());//QCPAxisTickerPi设置Pi刻度标签
    CustomPlot->xAxis->setTicker(pITicker);
    pITicker->setPiSymbol("");//设置数值后面π替换为*
    pITicker->setFractionStyle(QCPAxisTickerPi::fsFloatingPoint);//设置小数部分显示float型
    pITicker->setPiValue(1);//设置*表示的值 原代表π=3.14,先换为m_multiple//50ms传输一包,这里1秒就是20包,1/20=0.05
    //设置坐标标题
//    QString groupname[3]={"心率","血氧","体温"};
//    QString plotname=QString(groupname[mode-1]);
//    CustomPlot->xAxis->setLabel(QString::fromUtf8("时间(s)"));
//    CustomPlot->yAxis->setLabel(QString::fromUtf8("plotname"));
    //设置坐标轴范围
    CustomPlot->xAxis->setRange(0,1000);//设置x轴范围
    CustomPlot->yAxis->setRange(-5,5);//设置y轴范围
    if(mode==1)CustomPlot->yAxis2->setRange(0,200);//设置y轴范围
    //设置网格虚线
//    CustomPlot->xAxis->grid()->setVisible(false);
//    CustomPlot->yAxis->grid()->setVisible(false);
    //设置风格颜色
    QLinearGradient plotGradient;
    plotGradient.setStart(0, 0);
    plotGradient.setFinalStop(0, 350);
    plotGradient.setColorAt(0, QColor(220, 220, 220));//80, 80, 80
    plotGradient.setColorAt(1, QColor(120, 120, 120));//50, 50, 50
    CustomPlot->setBackground(plotGradient);      // 设置背景颜色
    QLinearGradient axisRectGradient;
    axisRectGradient.setStart(0, 0);
    axisRectGradient.setFinalStop(0, 350);
    axisRectGradient.setColorAt(0, QColor(220, 220, 220));//80, 80, 80
    axisRectGradient.setColorAt(1, QColor(120, 120, 120));//30, 30, 30
    CustomPlot->axisRect()->setBackground(axisRectGradient);   // 设置QCPAxisRect背景颜色
    CustomPlot->xAxis->setBasePen(QPen(Qt::black,2));//设置x轴坐标轴颜色
    CustomPlot->yAxis->setBasePen(QPen(Qt::black,2));//设置y轴坐标轴颜色//black
    if(mode==1)CustomPlot->yAxis2->setBasePen(QPen(Qt::black,2));//设置y轴坐标轴颜色//black
    CustomPlot->xAxis->setTickPen(QPen(Qt::black, 2));  // 轴刻度线的画笔
    CustomPlot->yAxis->setTickPen(QPen(Qt::black,2));//black
    if(mode==1)CustomPlot->yAxis2->setTickPen(QPen(Qt::black,2));//black
    CustomPlot->xAxis->setSubTickPen(QPen(Qt::black, 2)); // 轴子刻度线的画笔
    CustomPlot->yAxis->setSubTickPen(QPen(Qt::black,2));//black
    if(mode==1)CustomPlot->yAxis2->setSubTickPen(QPen(Qt::black,2));//black
    CustomPlot->xAxis->setTickLabelColor(Qt::black);//设置x轴坐标颜色
    CustomPlot->yAxis->setTickLabelColor(Qt::black);//设置y轴坐标颜色
    if(mode==1)CustomPlot->yAxis2->setTickLabelColor(Qt::black);//设置y轴坐标颜色
    CustomPlot->xAxis->setLabelColor(Qt::black);//设置x轴名称颜色
    CustomPlot->yAxis->setLabelColor(Qt::black);//设置y轴名称颜色
    if(mode==1)CustomPlot->yAxis2->setLabelColor(Qt::black);//设置y轴名称颜色
    //设置曲线名称显示
    CustomPlot->legend->setBrush(QColor(0, 0, 0, 0));//设置图例提示背景色(曲线名称背景色)
    CustomPlot->legend->setVisible(false);//设置曲线名称不可见
    CustomPlot->legend->setTextColor(Qt::black);//black
    CustomPlot->replot();//重绘制
}
//刷新曲线1
void MainWindow::QCustomPlot_Updata1(QCustomPlot *CustomPlot)
{
//    static QVector x_vec_p,x_p; //存放数据的容器  在h文件中声明,这里声明再次进入界面崩溃,不知道为什么
    uint x_number=x_num1;
    double y_value1=y_history[0].last();
    double y_value2=y_history[1].last();
    if(x_numberxAxis->setRange(0,1000);//设置范围正好 能显示当前点
    }
    else{//容器数据现在是正好1000个  把第一个出栈  把第1001个入栈  正好还是1000个数据
        x_vec_p1.removeFirst();
        x_vec_p1_2.removeFirst();
        x_p1.removeFirst();
        //入栈
        x_vec_p1.append(y_value1);//新值数
        x_vec_p1_2.append(y_value2);//新值数
        x_p1.append(x_number);
        CustomPlot->xAxis->setRange(x_p1.at(0),x_p1.at(x_p1.size()-1));
    }
    //设置坐标轴范围
    CustomPlot->yAxis->setRange(0,255);//设置y轴范围
    CustomPlot->yAxis2->setRange(0,200);//设置y轴范围
    CustomPlot->graph(0)->setData(x_p1,x_vec_p1);//设置数据
    CustomPlot->graph(1)->setData(x_p1,x_vec_p1_2);//设置数据
//    CustomPlot->yAxis->rescale(true);//设置Y轴坐标系 自动缩放以正常显示所有的数据
//    CustomPlot->graph(0)->rescaleAxes(true);//根据图像最高点最低点自动缩放坐标轴
//    CustomPlot->yAxis2->rescale(true);//设置Y轴坐标系 自动缩放以正常显示所有的数据
//    CustomPlot->graph(1)->rescaleAxes(true);//根据图像最高点最低点自动缩放坐标轴
    CustomPlot->replot();//重绘制
    x_num1++;
}
//刷新曲线2
void MainWindow::QCustomPlot_Updata2(QCustomPlot *CustomPlot)
{
//    static QVector x_vec_p,x_p; //存放数据的容器  在h文件中声明,这里声明再次进入界面崩溃,不知道为什么
    uint x_number=x_num2;
    double y_value=y_history[2].last();
    if(x_numberxAxis->setRange(0,1000);//设置范围正好 能显示当前点
    }
    else{//容器数据现在是正好1000个  把第一个出栈  把第1001个入栈  正好还是1000个数据
        x_vec_p2.removeFirst();
        x_p2.removeFirst();
        //入栈
        x_vec_p2.append(y_value);//新值数
        x_p2.append(x_number);
        CustomPlot->xAxis->setRange(x_p2.at(0),x_p2.at(x_p2.size()-1));
    }
    //设置坐标轴范围
    CustomPlot->yAxis->setRange(0,150);//设置y轴范围
    CustomPlot->graph(0)->setData(x_p2,x_vec_p2);//设置数据
//    CustomPlot->yAxis->rescale(true);//设置Y轴坐标系 自动缩放以正常显示所有的数据
//    CustomPlot->graph(0)->rescaleAxes(true);//根据图像最高点最低点自动缩放坐标轴
    CustomPlot->replot();//重绘制
    x_num2++;
}
//刷新曲线3
void MainWindow::QCustomPlot_Updata3(QCustomPlot *CustomPlot)
{
//    static QVector x_vec_p,x_p; //存放数据的容器  在h文件中声明,这里声明再次进入界面崩溃,不知道为什么
    uint x_number=x_num3;
    double y_value=y_history[3].last();
    if(x_numberxAxis->setRange(0,1000);//设置范围正好 能显示当前点
    }
    else{//容器数据现在是正好1000个  把第一个出栈  把第1001个入栈  正好还是1000个数据
        x_vec_p3.removeFirst();
        x_p3.removeFirst();
        //入栈
        x_vec_p3.append(y_value);//新值数
        x_p3.append(x_number);
        CustomPlot->xAxis->setRange(x_p3.at(0),x_p3.at(x_p3.size()-1));
    }
    //设置坐标轴范围
    CustomPlot->yAxis->setRange(minValue(x_vec_p3)-2,maxValue(x_vec_p3)+2);//设置y轴范围,最低温度-2,最高温度+2
    CustomPlot->graph(0)->setData(x_p3,x_vec_p3);//设置数据
//    CustomPlot->yAxis->rescale(true);//设置Y轴坐标系 自动缩放以正常显示所有的数据
//    CustomPlot->graph(0)->rescaleAxes(true);//根据图像最高点最低点自动缩放坐标轴
    CustomPlot->replot();//重绘制
    x_num3++;
}
//初始化曲线数据1.2.3
void MainWindow::updatedata(uint mode)
{
    //计算曲线需求值
    QVector shortdata1;
    shortdata1.clear();
    for(int i=0;ilabel_show3,ui->label_show4,ui->label_show5,ui->label_show6,ui->label_show7,ui->label_show8,ui->label_show9};
    for(int i=0;isetText(QString::number(m_cursor_1[i])+groupunit[i]);
    ui->label_shuoming1->setText(QString::number(y_history[1].last()));
    ui->label_shuoming2->setText(QString::number(y_history[2].last()));
    ui->label_shuoming3->setText(QString::number(y_history[3].last()));
}
//求最大值
double MainWindow::maxValue(QVector list)
{
    if(list.count() == 0) return 0;
    double max=list.at(0);
    foreach(double each,list){
        if(max>each){
            max = max;
        }
        else{
            max = each;
        }
    }
    return max;
}
//求最小值
double MainWindow::minValue(QVector list)
{
    if(list.count() == 0) return 0;
    double min = list.at(0);
    foreach(double each,list){
        if(min