
如有错误,恳请指出。
在本地上,可以安装一些软件,比如:Meshlab,CloudCompare等3D查看工具来对点云进行可视化。而这篇博客是将介绍一些代码工具将KITTI数据集进行可视化操作,包括点云鸟瞰图,FOV图,以及标注信息在图像+点云上的显示。
文章目录
- 1. 数据集准备
- 2. 环境准备
- 3. KITTI数据集可视化
- 4. 点云可视化
- 5. 鸟瞰图可视化
1. 数据集准备
KITTI数据集作为自动驾驶领域的经典数据集之一,比较适合我这样的新手入门。以下资料是为了实现对KITTI数据集的可视化操作。首先在官网下载对应的数据:http://www.cvlibs.net/datasets/kitti/eval_object.php?obj_benchmark=3d,下载后数据的目录文件结构如下所示:
├── dataset
│   ├── KITTI
│   │   ├── object
│   │   │   ├──KITTI
│   │   │      ├──ImageSets
│   │   │   ├──training
│   │   │      ├──calib & velodyne & label_2 & image_2
2. 环境准备
这里使用了一个kitti数据集可视化的开源代码:https://github.com/kuixu/kitti_object_vis,按照以下操作新建一个虚拟环境,并安装所需的工具包。其中千万不要安装python3.7以上的版本,因为vtk不支持。
# 新建python=3.7的虚拟环境
conda create -n kitti_vis python=3.7 # vtk does not support python 3.8
conda activate kitti_vis
# 安装opencv, pillow, scipy, matplotlib工具包
pip install opencv-python pillow scipy matplotlib
# 安装3D可视化工具包(以下指令会自动安转所需的vtk与pyqt5)
conda install mayavi -c conda-forge
# 测试
python kitti_object.py --show_lidar_with_depth --img_fov --const_box --vis
3. KITTI数据集可视化
下面依次展示 KITTI 数据集可视化结果,这里通过设置 data_idx=10 来展示编号为000010的数据,代码中dataset需要修改为数据集实际路径。(最后会贴上完整代码)
def visualization():
    import mayavi.mlab as mlab
    dataset = kitti_object(os.path.join(ROOT_DIR, '../dataset/KITTI/object'))

    # determine data_idx
    data_idx = 100

    # Load data from dataset
    objects = dataset.get_label_objects(data_idx)
    print("There are %d objects.", len(objects))
    img = dataset.get_image(data_idx)
    img = cv2.cvtColor(img, cv2.COLOR_BGR2RGB)
    img_height, img_width, img_channel = img.shape
    pc_velo = dataset.get_lidar(data_idx)[:,0:3]
    calib = dataset.get_calibration(data_idx)
代码来源于参考资料,在后面会贴上我自己修改的测试代码。以下包含9种可视化的操作:
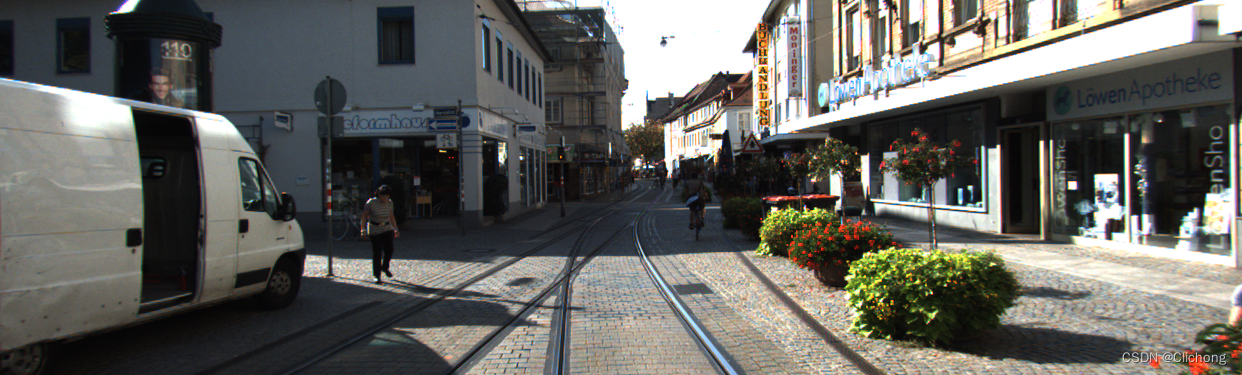
- 1. 图像显示
def show_image(self):
    Image.fromarray(self.img).show()
    cv2.waitKey(0)
结果展示:
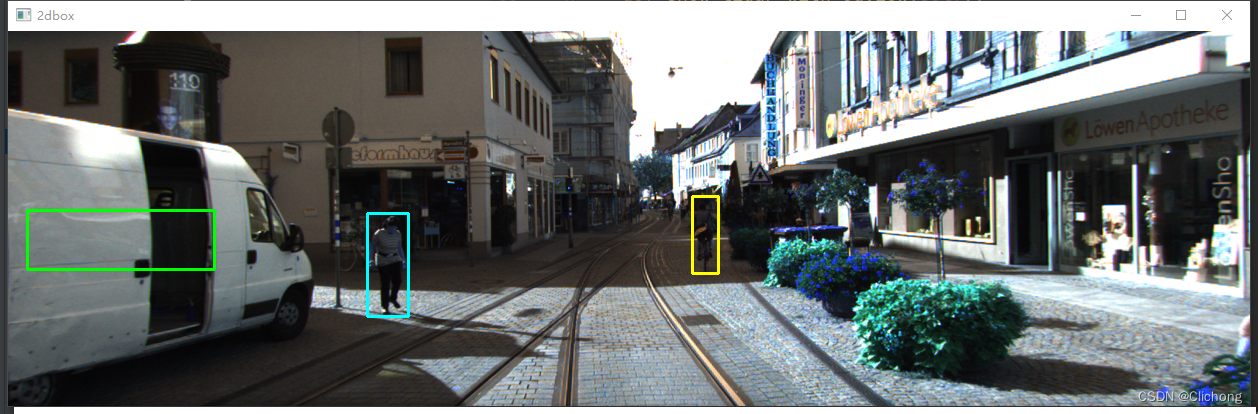
- 2. 图片上绘制2D bbox
    def show_image_with_2d_boxes(self):
        show_image_with_boxes(self.img, self.objects, self.calib, show3d=False)
        cv2.waitKey(0)
结果展示:
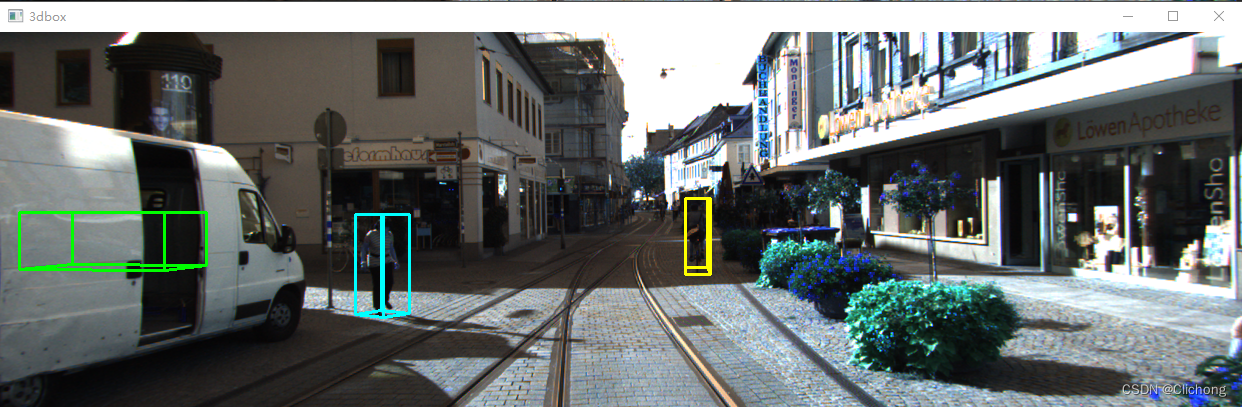
- 3. 图片上绘制3D bbox
    def show_image_with_3d_boxes(self):
        show_image_with_boxes(self.img, self.objects, self.calib, show3d=True)
        cv2.waitKey(0)
结果展示:
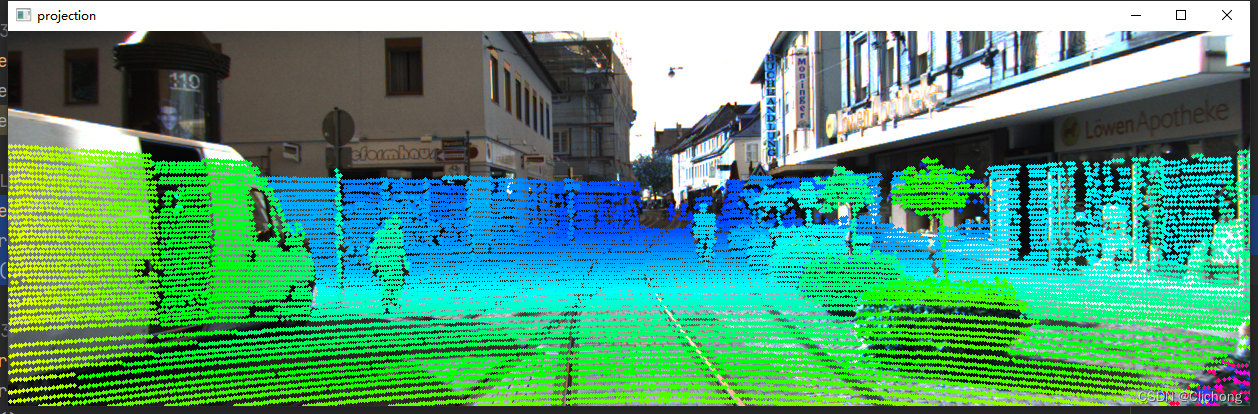
- 4. 图片上绘制Lidar投影
    def show_image_with_lidar(self):
        show_lidar_on_image(self.pc_velo, self.img, self.calib, self.img_width, self.img_height)
        mlab.show()
结果展示:
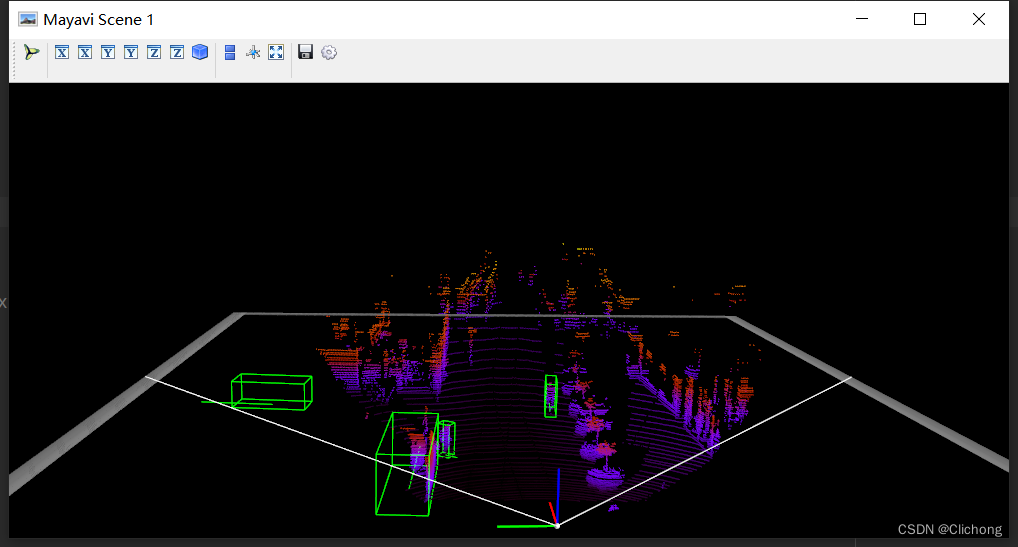
- 5. Lidar绘制3D bbox
    def show_lidar_with_3d_boxes(self):
        show_lidar_with_boxes(self.pc_velo, self.objects, self.calib, True, self.img_width, self.img_height)
        mlab.show()
结果展示:
- 6. Lidar绘制FOV图
    def show_lidar_with_fov(self):
        imgfov_pc_velo, pts_2d, fov_inds = get_lidar_in_image_fov(self.pc_velo, self.calib,
                   0, 0, self.img_width, self.img_height, True)
        draw_lidar(imgfov_pc_velo)
        mlab.show()
结果展示:
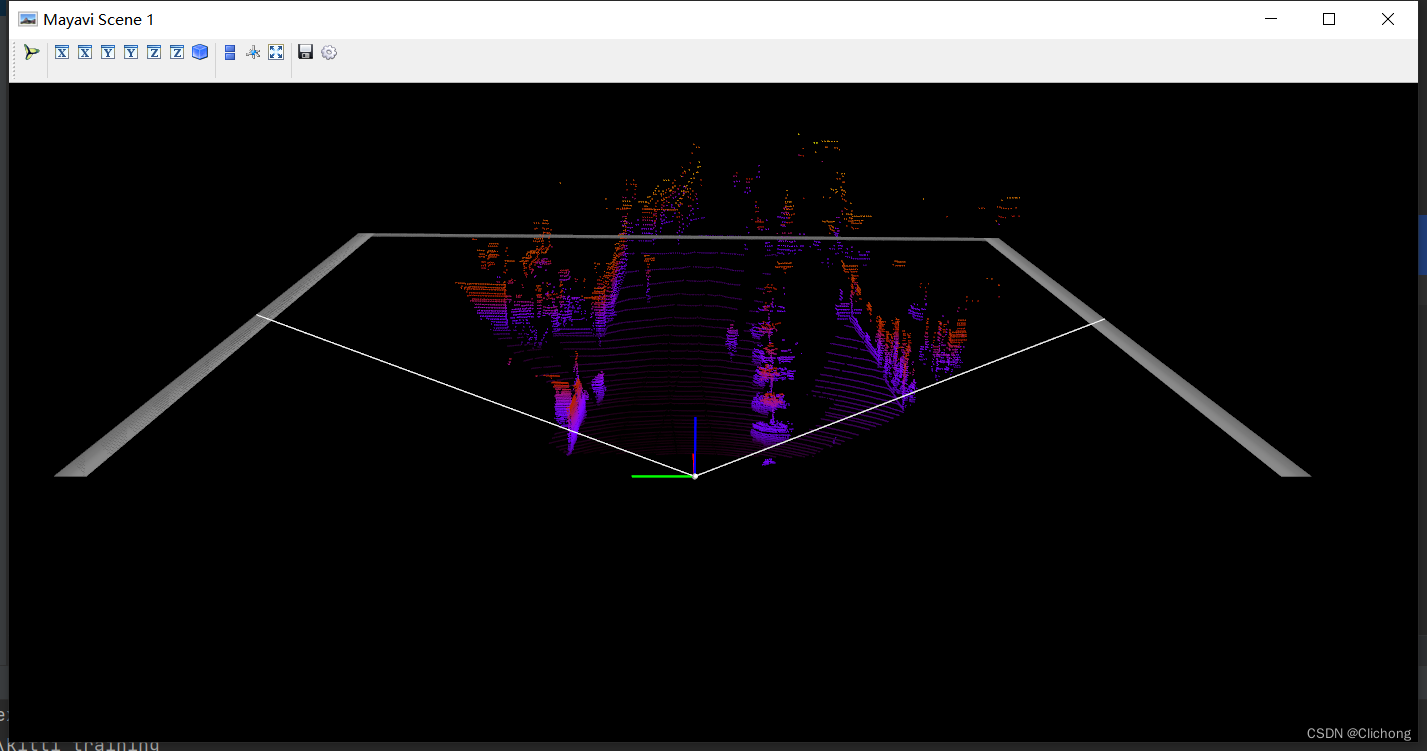
- 7. Lidar绘制3D图
    def show_lidar_with_3dview(self):
        draw_lidar(self.pc_velo)
        mlab.show()
结果展示:
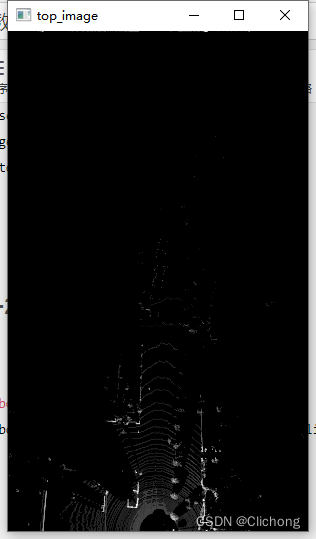
- 8. Lidar绘制BEV图
BEV图的显示与其他视图不一样,这里的代码需要有点改动,因为这里需要lidar点云的其他维度信息,所以输入不仅仅是xyz三个维度。改动代码:
# 初始
pc_velo = dataset.get_lidar(data_idx)[:, 0:3]
# 改为(要增加其他维度才可以查看BEV视图)
pc_velo = dataset.get_lidar(data_idx)[:, 0:4]
测试代码:
    def show_lidar_with_bev(self):
        from kitti_util import draw_top_image, lidar_to_top
        top_view = lidar_to_top(self.pc_velo)
        top_image = draw_top_image(top_view)
        cv2.imshow("top_image", top_image)
        cv2.waitKey(0)
结果展示:
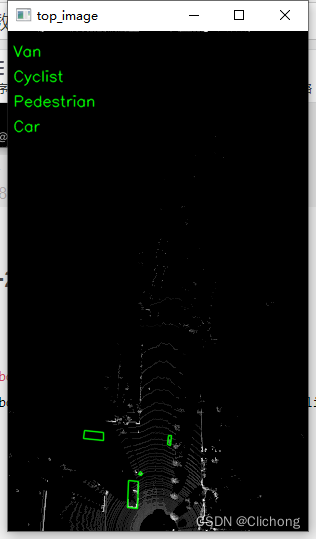
- 9. Lidar绘制BEV图+2D bbox
同样,这里的代码改动与3.8节一样,需要点云的其他维度信息
    def show_lidar_with_bev_2d_bbox(self):
        show_lidar_topview_with_boxes(self.pc_velo, self.objects, self.calib)
        mlab.show()
结果展示:
- 完整测试代码
参考代码:
import mayavi.mlab as mlab
from kitti_object import kitti_object, show_image_with_boxes, show_lidar_on_image, \
    show_lidar_with_boxes, show_lidar_topview_with_boxes, get_lidar_in_image_fov, \
    show_lidar_with_depth
from viz_util import draw_lidar
import cv2
from PIL import Image
import time
class visualization:
    # data_idx: determine data_idx
    def __init__(self, root_dir=r'E:\Study\Machine Learning\Dataset3d\kitti', data_idx=100):
        dataset = kitti_object(root_dir=root_dir)
        # Load data from dataset
        objects = dataset.get_label_objects(data_idx)
        print("There are {} objects.".format(len(objects)))
        img = dataset.get_image(data_idx)
        img = cv2.cvtColor(img, cv2.COLOR_BGR2RGB)
        img_height, img_width, img_channel = img.shape
        pc_velo = dataset.get_lidar(data_idx)[:, 0:3]  # 显示bev视图需要改动为[:, 0:4]
        calib = dataset.get_calibration(data_idx)
        # init the params
        self.objects = objects
        self.img = img
        self.img_height = img_height
        self.img_width = img_width
        self.img_channel = img_channel
        self.pc_velo = pc_velo
        self.calib = calib
    # 1. 图像显示
    def show_image(self):
        Image.fromarray(self.img).show()
        cv2.waitKey(0)
    # 2. 图片上绘制2D bbox
    def show_image_with_2d_boxes(self):
        show_image_with_boxes(self.img, self.objects, self.calib, show3d=False)
        cv2.waitKey(0)
    # 3. 图片上绘制3D bbox
    def show_image_with_3d_boxes(self):
        show_image_with_boxes(self.img, self.objects, self.calib, show3d=True)
        cv2.waitKey(0)
    # 4. 图片上绘制Lidar投影
    def show_image_with_lidar(self):
        show_lidar_on_image(self.pc_velo, self.img, self.calib, self.img_width, self.img_height)
        mlab.show()
    # 5. Lidar绘制3D bbox
    def show_lidar_with_3d_boxes(self):
        show_lidar_with_boxes(self.pc_velo, self.objects, self.calib, True, self.img_width, self.img_height)
        mlab.show()
    # 6. Lidar绘制FOV图
    def show_lidar_with_fov(self):
        imgfov_pc_velo, pts_2d, fov_inds = get_lidar_in_image_fov(self.pc_velo, self.calib,
                   0, 0, self.img_width, self.img_height, True)
        draw_lidar(imgfov_pc_velo)
        mlab.show()
    # 7. Lidar绘制3D图
    def show_lidar_with_3dview(self):
        draw_lidar(self.pc_velo)
        mlab.show()
    # 8. Lidar绘制BEV图
    def show_lidar_with_bev(self):
        from kitti_util import draw_top_image, lidar_to_top
        top_view = lidar_to_top(self.pc_velo)
        top_image = draw_top_image(top_view)
        cv2.imshow("top_image", top_image)
        cv2.waitKey(0)
    # 9. Lidar绘制BEV图+2D bbox
    def show_lidar_with_bev_2d_bbox(self):
        show_lidar_topview_with_boxes(self.pc_velo, self.objects, self.calib)
        mlab.show()
if __name__ == '__main__':
    kitti_vis = visualization()
    # kitti_vis.show_image()
    # kitti_vis.show_image_with_2d_boxes()
    # kitti_vis.show_image_with_3d_boxes()
    # kitti_vis.show_image_with_lidar()
    # kitti_vis.show_lidar_with_3d_boxes()
    # kitti_vis.show_lidar_with_fov()
    # kitti_vis.show_lidar_with_3dview()
    # kitti_vis.show_lidar_with_bev()
    kitti_vis.show_lidar_with_bev_2d_bbox()
    # print('...')
    # cv2.waitKey(0)
此外,下面再提供两份可视化代码。
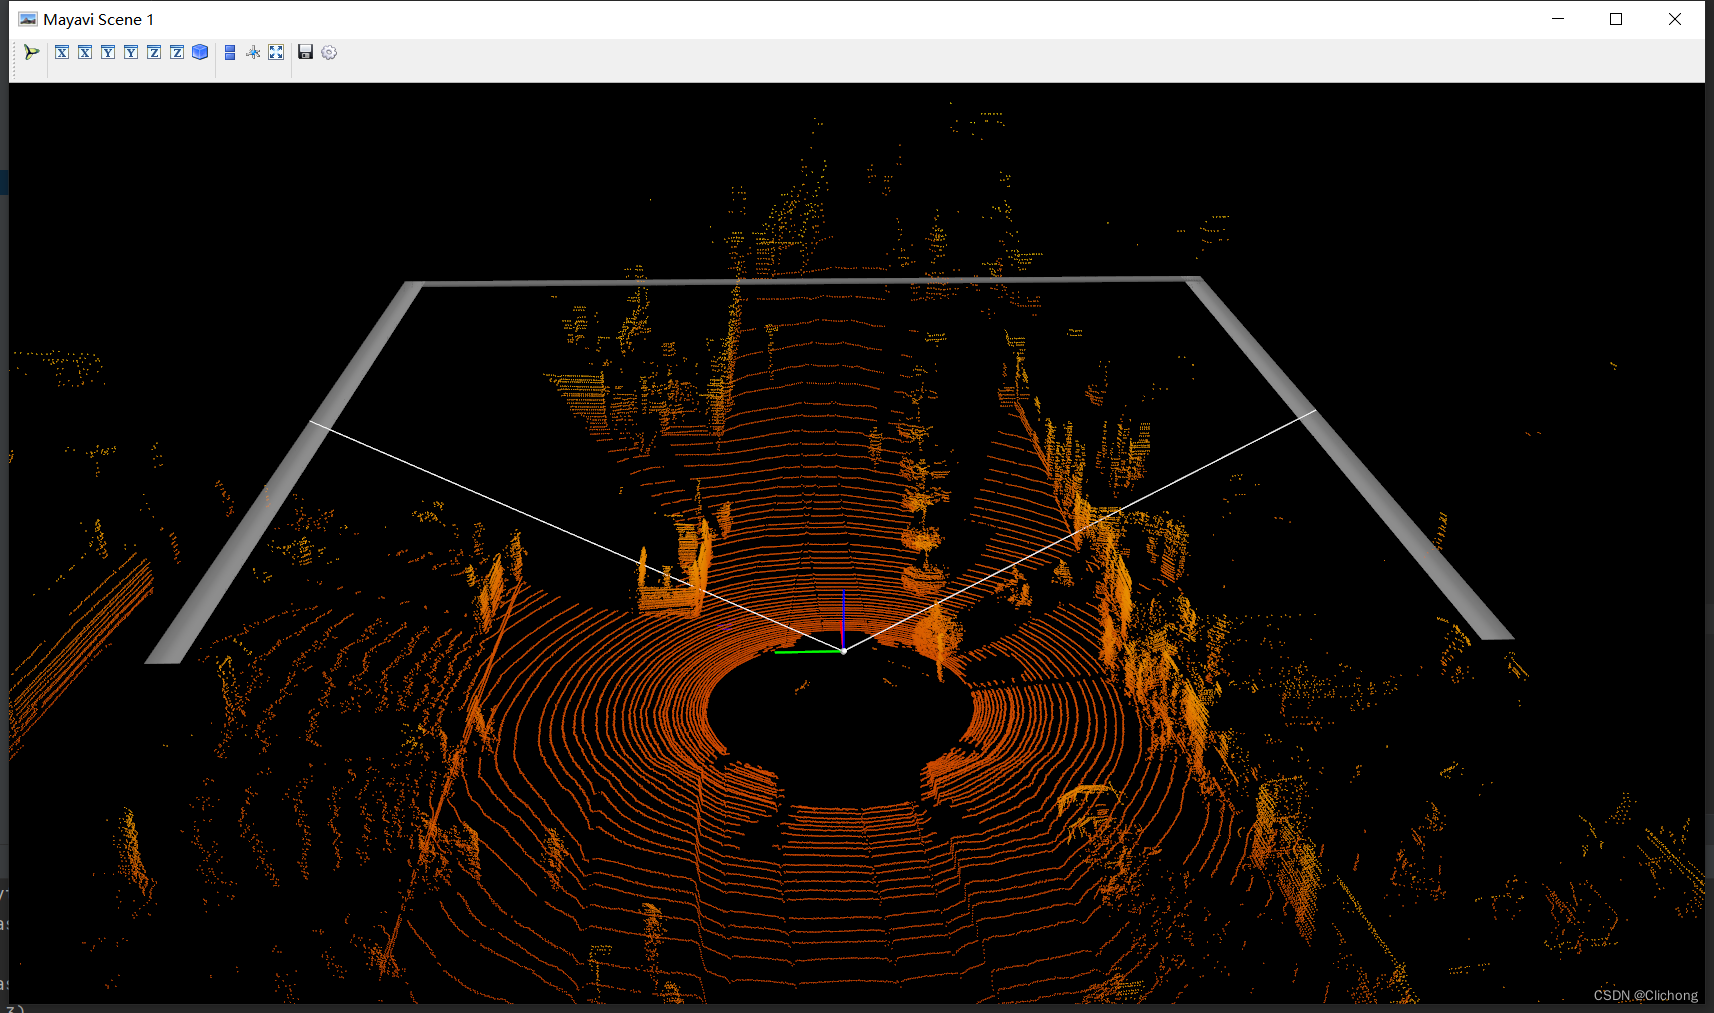
4. 点云可视化
这里的同样使用的是上述的图例,且直接输入的KITTI数据集的.bin文件,即可显示点云图像。
- 参考代码:
import numpy as np import mayavi.mlab import os # 000010.bin这里需要填写文件的位置 # bin_file = '../data/object/training/velodyne/000000.bin' # assert os.path.exists(bin_file), "{} is not exists".format(bin_file) kitti_file = r'E:\Study\Machine Learning\Dataset3d\kitti\training\velodyne\000100.bin' pointcloud = np.fromfile(file=kitti_file, dtype=np.float32, count=-1).reshape([-1, 4]) # pointcloud = np.fromfile(str("000010.bin"), dtype=np.float32, count=-1).reshape([-1, 4]) print(pointcloud.shape) x = pointcloud[:, 0] # x position of point y = pointcloud[:, 1] # y position of point z = pointcloud[:, 2] # z position of point r = pointcloud[:, 3] # reflectance value of point d = np.sqrt(x ** 2 + y ** 2) # Map Distance from sensor vals = 'height' if vals == "height": col = z else: col = d fig = mayavi.mlab.figure(bgcolor=(0, 0, 0), size=(640, 500)) mayavi.mlab.points3d(x, y, z, col, # Values used for Color mode="point", colormap='spectral', # 'bone', 'copper', 'gnuplot' # color=(0, 1, 0), # Used a fixed (r,g,b) instead figure=fig, ) x = np.linspace(5, 5, 50) y = np.linspace(0, 0, 50) z = np.linspace(0, 5, 50) mayavi.mlab.plot3d(x, y, z) mayavi.mlab.show()- 输出结果:
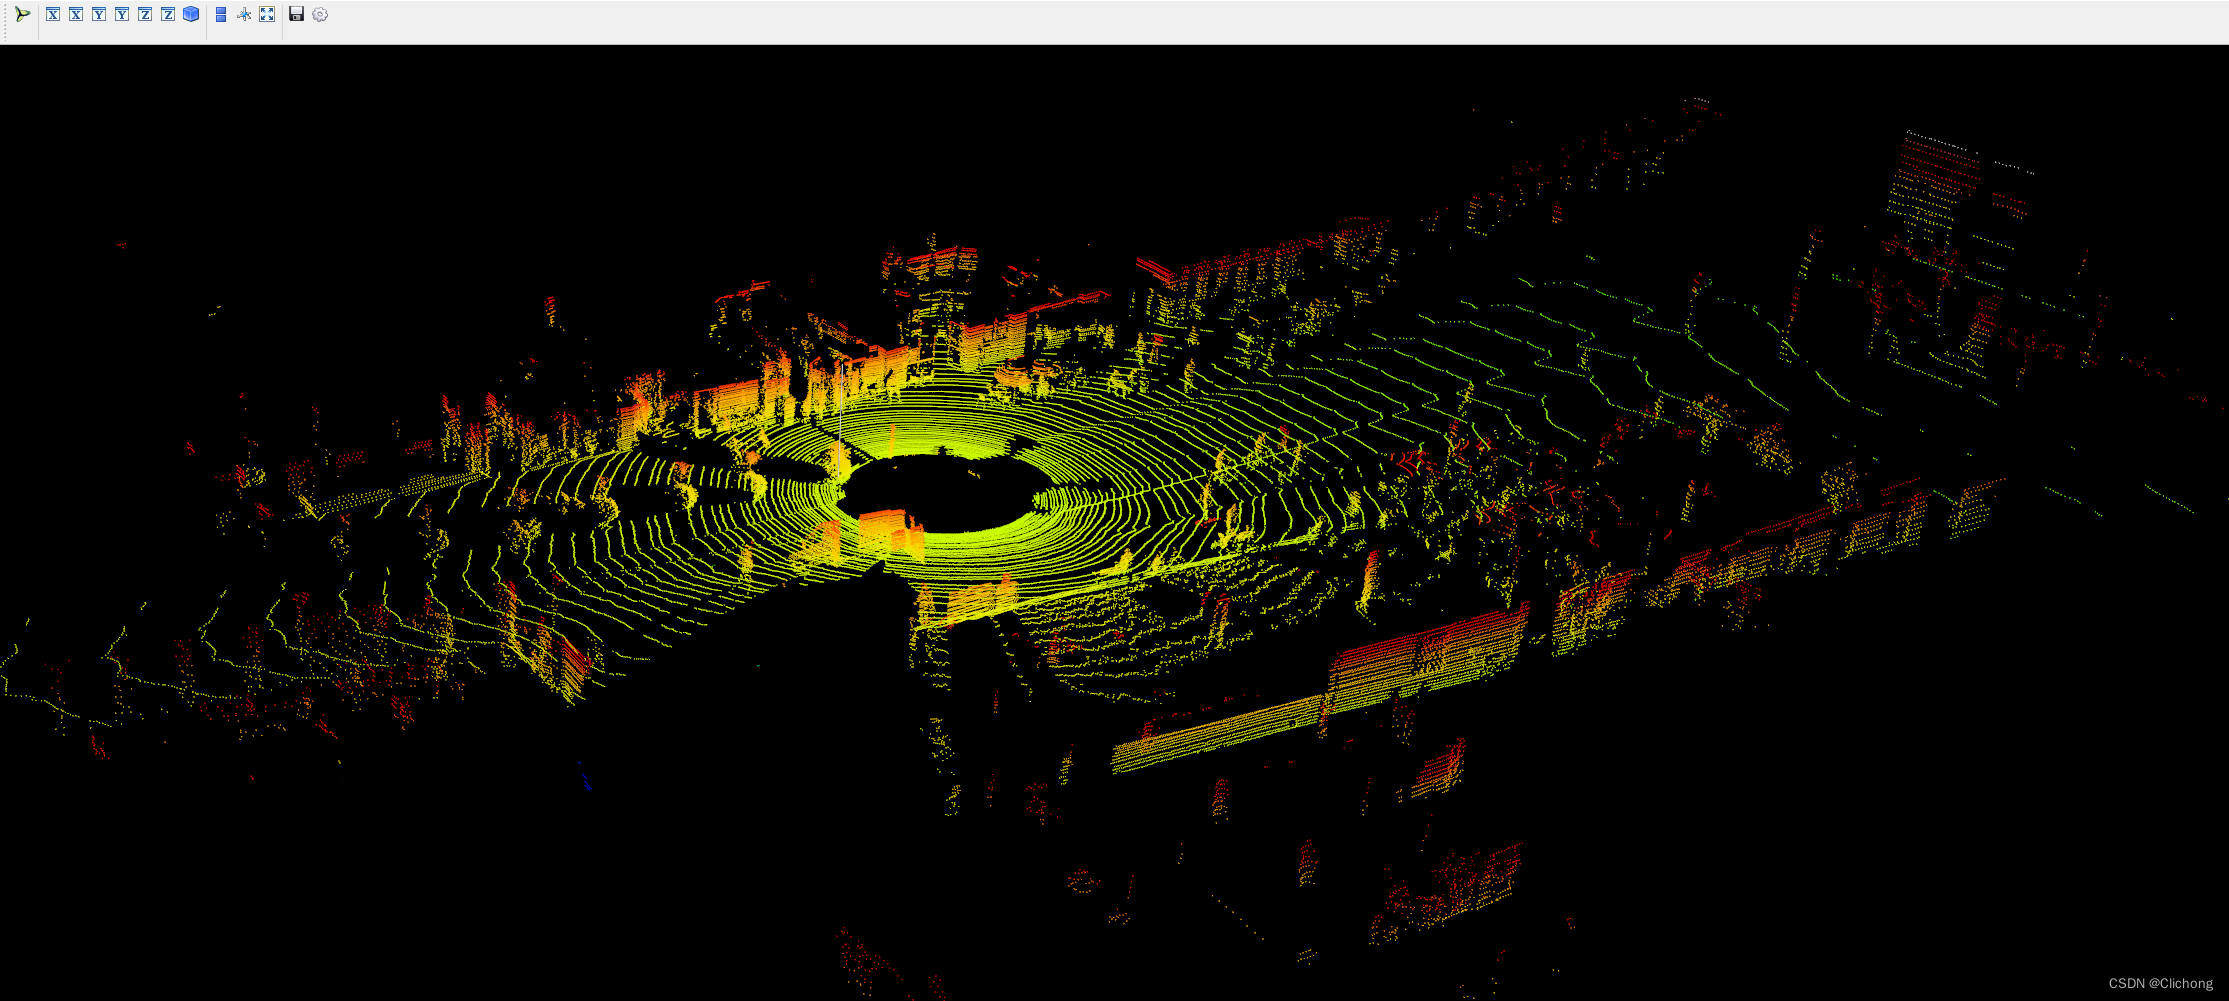
ps:这里的输出点云结果相比上面的点云输出结果更加的完善,而且参考的中心坐标点也不一样。
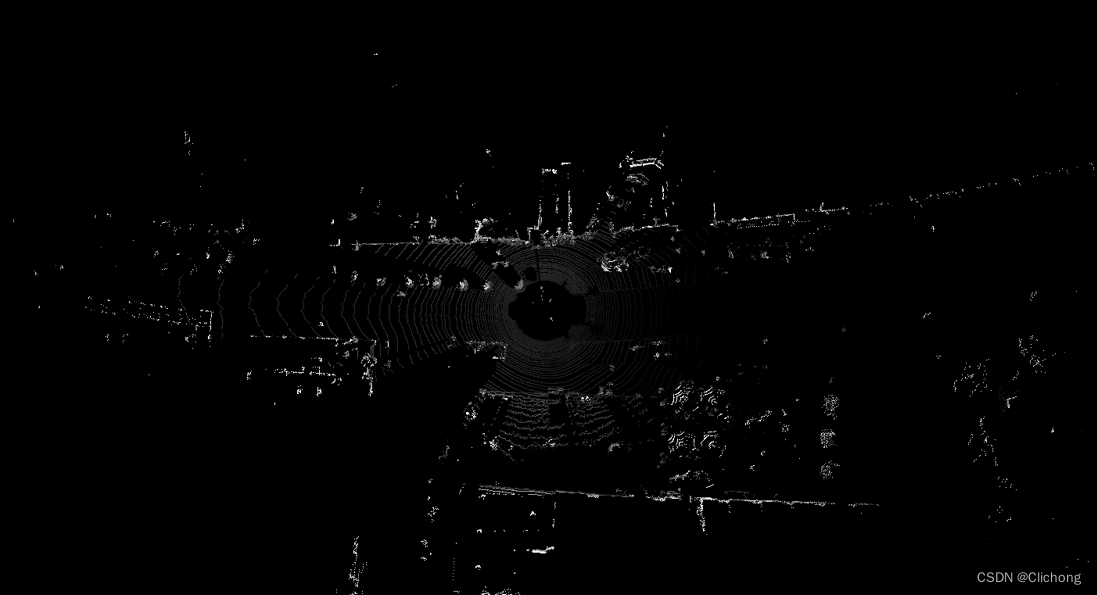
5. 鸟瞰图可视化
代码中的鸟瞰图范围可以自行设置。同样,输入的也只需要是.bin文件即可展示其鸟瞰图。
- 参考代码:
import numpy as np
from PIL import Image
import matplotlib.pyplot as plt
# 点云读取:000010.bin这里需要填写文件的位置
kitti_file = r'E:\Study\Machine Learning\Dataset3d\kitti\training\velodyne\000100.bin'
pointcloud = np.fromfile(file=kitti_file, dtype=np.float32, count=-1).reshape([-1, 4])
# 设置鸟瞰图范围
side_range = (-40, 40)  # 左右距离
# fwd_range = (0, 70.4)  # 后前距离
fwd_range = (-70.4, 70.4)
x_points = pointcloud[:, 0]
y_points = pointcloud[:, 1]
z_points = pointcloud[:, 2]
# 获得区域内的点
f_filt = np.logical_and(x_points > fwd_range[0], x_points  side_range[0], y_points
- 结果展示:
后续的工作会加深对点云数据的理解,整个可视化项目的工程见:KITTI数据集的可视化项目,有需要的朋友可以自行下载。
参考资料:
1. KITTI自动驾驶数据集可视化教程
2. kitti数据集在3D目标检测中的入门
3. kitti数据集在3D目标检测中的入门(二)可视化详解
4. kitti_object_vis项目
- 结果展示:
- 参考代码:
- 输出结果:
- 参考代码:
- 完整测试代码
- 9. Lidar绘制BEV图+2D bbox
- 8. Lidar绘制BEV图
- 7. Lidar绘制3D图
- 6. Lidar绘制FOV图
- 5. Lidar绘制3D bbox
- 4. 图片上绘制Lidar投影
- 3. 图片上绘制3D bbox
- 2. 图片上绘制2D bbox
- 1. 图像显示